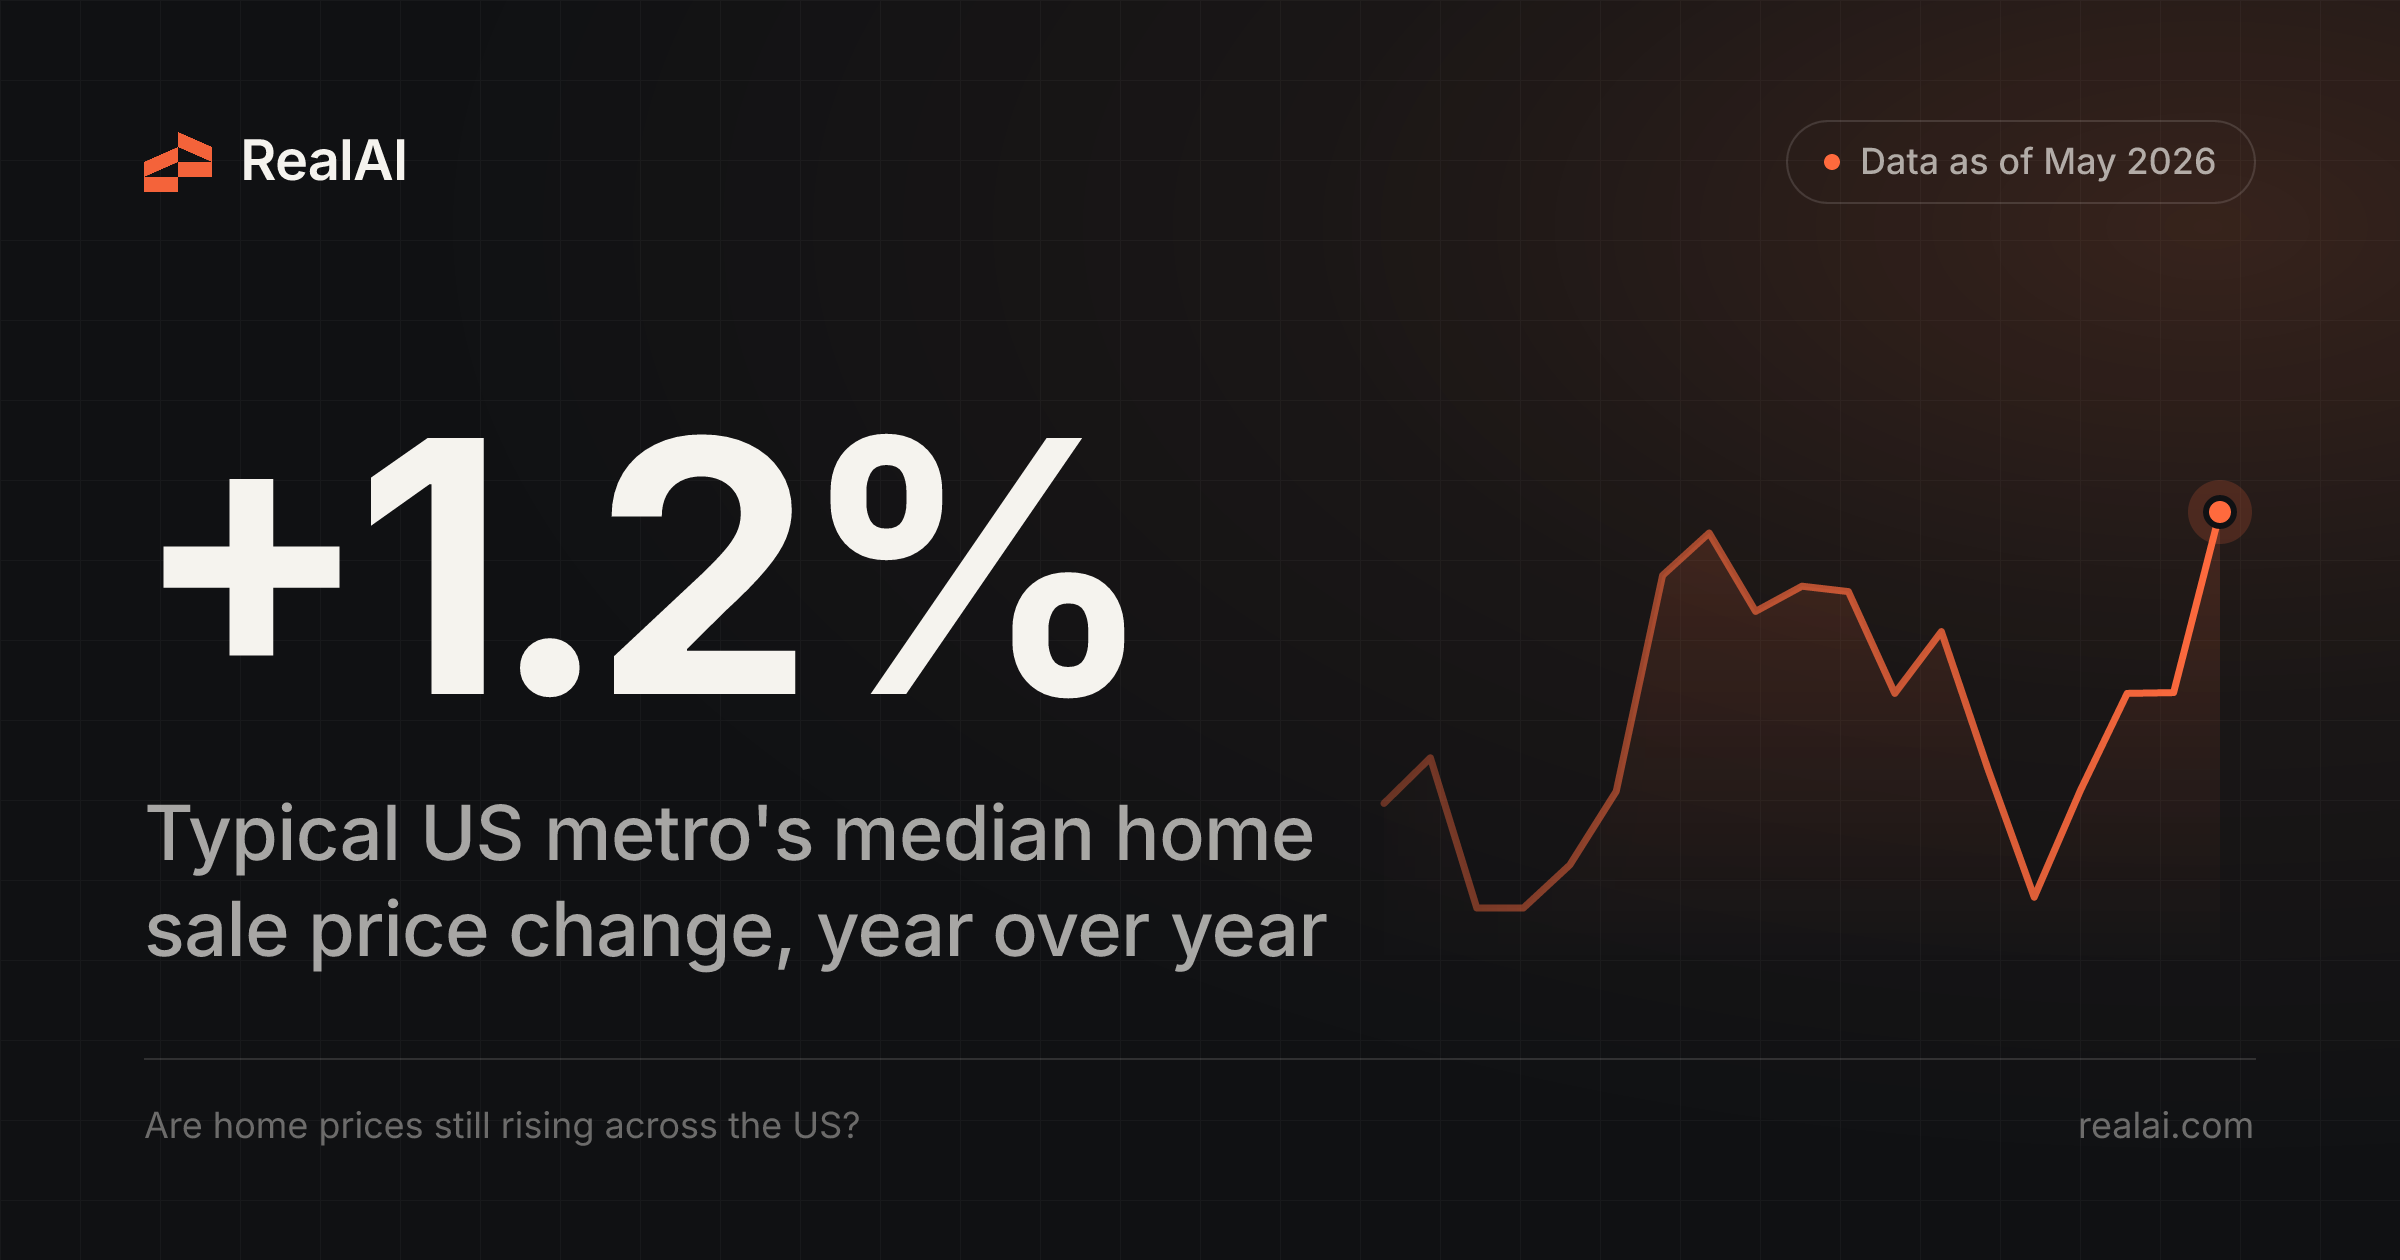

Yes, but only a little, and not everywhere. As of May 2026, the typical US metro's median home sale price was 1.2% higher than in May 2025, according to RealAI. Estimated home values rose 0.7%. Gains were uneven: 431 of 925 metros, about 47%, had lower estimated values than a year earlier, and large metros were flat overall.
| Measure (May 2026 vs May 2025) | May 2025 | May 2026 | Change |
|---|---|---|---|
| Median sale price, cross-metro median | $255,500 | $258,457 | +1.2%* |
| Median estimated home value, cross-metro median | $242,551 | $243,426 | +0.7%* |
| Metros with lower estimated values | 431 of 925 | 47% | |
| Metros with lower sale prices | 376 of 834 | 45% | |
| Large metros (1,000+ sales) with lower sale prices | 39 of 78 | 50% |
*Median of each metro's own year-over-year change, not the change between the two medians.
Prices are rising slowly
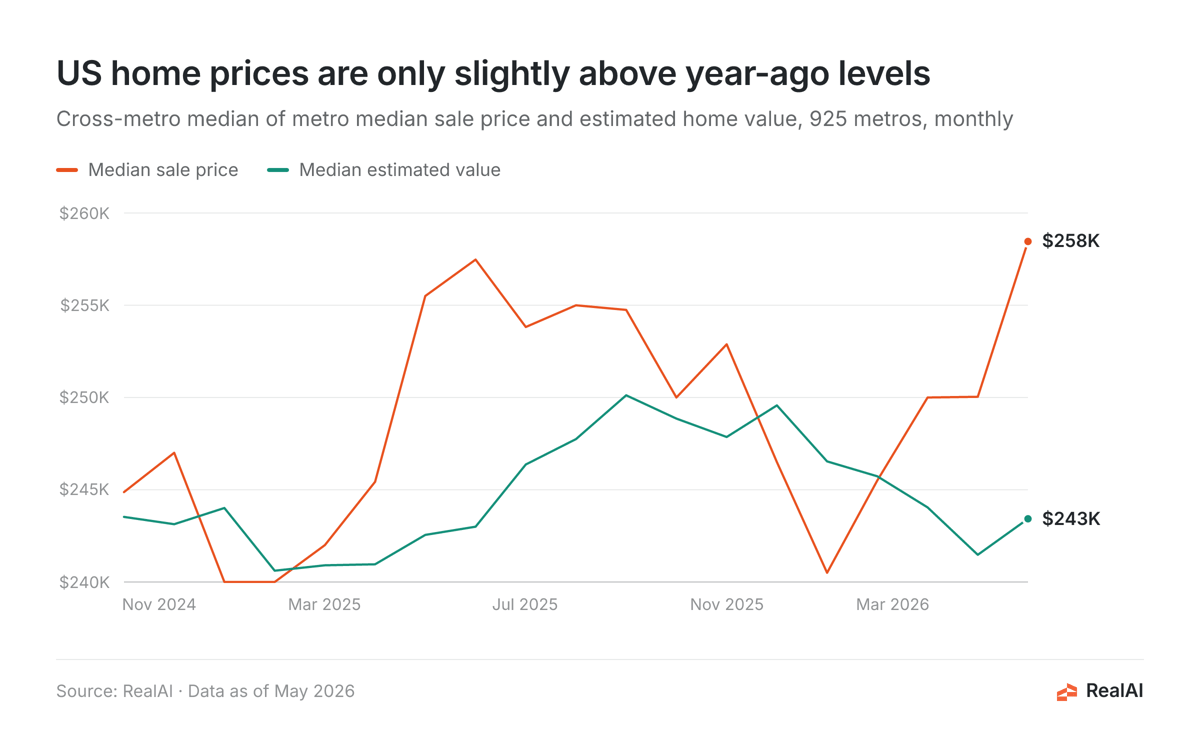
RealAI tracked recorded home sales and estimated values across 925 US metros. In the typical metro, the median sale price in May 2026 was $258,457, up from $255,500 a year earlier. Valuations moved in the same direction: the median estimated home value was $243,426, up from $242,551.
Neither figure points to a market that is falling apart, or one that is heating up. Both gains are small.
Metro medians also move around through the year. In the series below, sale prices were lowest around January and highest in late spring and early summer. That's why this post compares May with May, not May with an earlier month.
Almost half of metros are falling
The national median hides a split market. Across all 925 metros, 431 had a lower median estimated value in May 2026 than in May 2025. Among the 834 metros with sale price data for both years, 376 had a lower median sale price.
The split is sharper in big markets. Among the 78 metros that recorded at least 1,000 sales in both May 2025 and May 2026, the median sale price change was -0.2%, and exactly half (39) posted declines. Smaller metros are doing more of the rising.
Where prices rose and fell most
Among large metros (1,000+ recorded sales in both months), the biggest sale price gains were in the Midwest and the Carolinas. The biggest declines were led by Florida.
| Metro | Median sale price, May 2025 | Median sale price, May 2026 | Change |
|---|---|---|---|
| Kansas City, MO | $290,272 | $318,402 | +9.7% |
| Cleveland, OH | $217,900 | $235,000 | +7.8% |
| Rochester, NY | $256,000 | $275,750 | +7.7% |
| Salt Lake City, UT | $480,977 | $516,040 | +7.3% |
| Columbia, SC | $261,250 | $280,000 | +7.2% |
| Indianapolis, IN | $300,000 | $320,842 | +6.9% |
| Greenville, SC | $320,750 | $339,000 | +5.7% |
| Boise City, ID | $434,784 | $456,749 | +5.1% |
| San Francisco, CA | $1,200,000 | $1,255,000 | +4.6% |
| Grand Rapids, MI | $339,950 | $355,000 | +4.4% |
| Largest declines | |||
| Ocala, FL | $283,600 | $244,800 | -13.7% |
| Port St. Lucie, FL | $415,000 | $379,950 | -8.4% |
| Fayetteville, AR | $379,000 | $350,000 | -7.7% |
| Des Moines, IA | $293,000 | $275,000 | -6.1% |
| Virginia Beach, VA | $361,000 | $340,000 | -5.8% |
Florida stands out. Ocala and Port St. Lucie top the decline list, and Palm Bay (-5.5%) is not far behind. Many Midwest metros, including Kansas City, Cleveland, Indianapolis and Grand Rapids, are still posting solid gains from lower price levels.
Texas metros are missing from this table. Texas doesn't require sale prices to be disclosed, so recorded price data there is sparse.
What the most recent months show
Recorded sales arrive with a lag of up to three months, so the newest data is incomplete. RealAI's data was last updated September 30, 2026. August through October 2026 are flagged as partial. June and July are flagged as complete but sit inside that lag window. This post uses May 2026 as the latest month with settled data.
June points the same way as May: the median metro sale price was up 0.5% year over year, and estimated values were up 1.3%. July's early read is weaker, with sale prices down 2.1%. But July 2026 also shows about 13% fewer recorded sales than July 2025, which suggests some July sales haven't been recorded yet. Treat it as provisional.
How we calculated this
The figures come from RealAI, the real estate AI built by Fundrise. RealAI compiles monthly home sales and value data from county recorder of deeds records. The dataset covers 925 US metropolitan and micropolitan areas (CBSAs) and was last updated September 30, 2026.
For each metro, we took the median recorded sale price and the median estimated home value (from an automated valuation model) for May 2026 and for May 2025, as reported in the dataset. National figures are unweighted medians across metros, so every metro counts equally whatever its size. Year-over-year changes are calculated for each metro first, and then we take the median of those changes. The leader and laggard table includes only metros with at least 1,000 recorded sales in both May 2025 and May 2026. We ranked metros by sale price because estimated values for a single metro can swing from month to month.
FAQ
Are home prices falling in the US?
Not overall. As of May 2026, the typical metro's median sale price was up 1.2% from a year earlier. But about 47% of metros had lower estimated values, and large metros were flat, so prices are falling in many places.
Where are home prices dropping the most?
Florida. Among metros with at least 1,000 sales, Ocala (-13.7%) and Port St. Lucie (-8.4%) had the steepest sale price declines from May 2025 to May 2026. Palm Bay also fell more than 5%.
Where are home prices still rising fastest?
Mostly in the Midwest and Southeast. Kansas City (+9.7%), Cleveland (+7.8%), Rochester, NY (+7.7%), Salt Lake City (+7.3%) and Columbia, SC (+7.2%) led large metros.
Why use May 2026 instead of a more recent month?
Recorded sales take up to three months to fully arrive. Recent months undercount sales, so their medians can be misleading. May 2026 was the latest month with settled data when RealAI last updated the dataset.
Why is the national median price lower than other figures I've seen?
This is a median across metros, with each metro weighted equally, not a median of every home sold. Many small, lower-priced metros count as much as large ones. For comparison, the median across the 78 large metros was $351,250 in May 2026.