
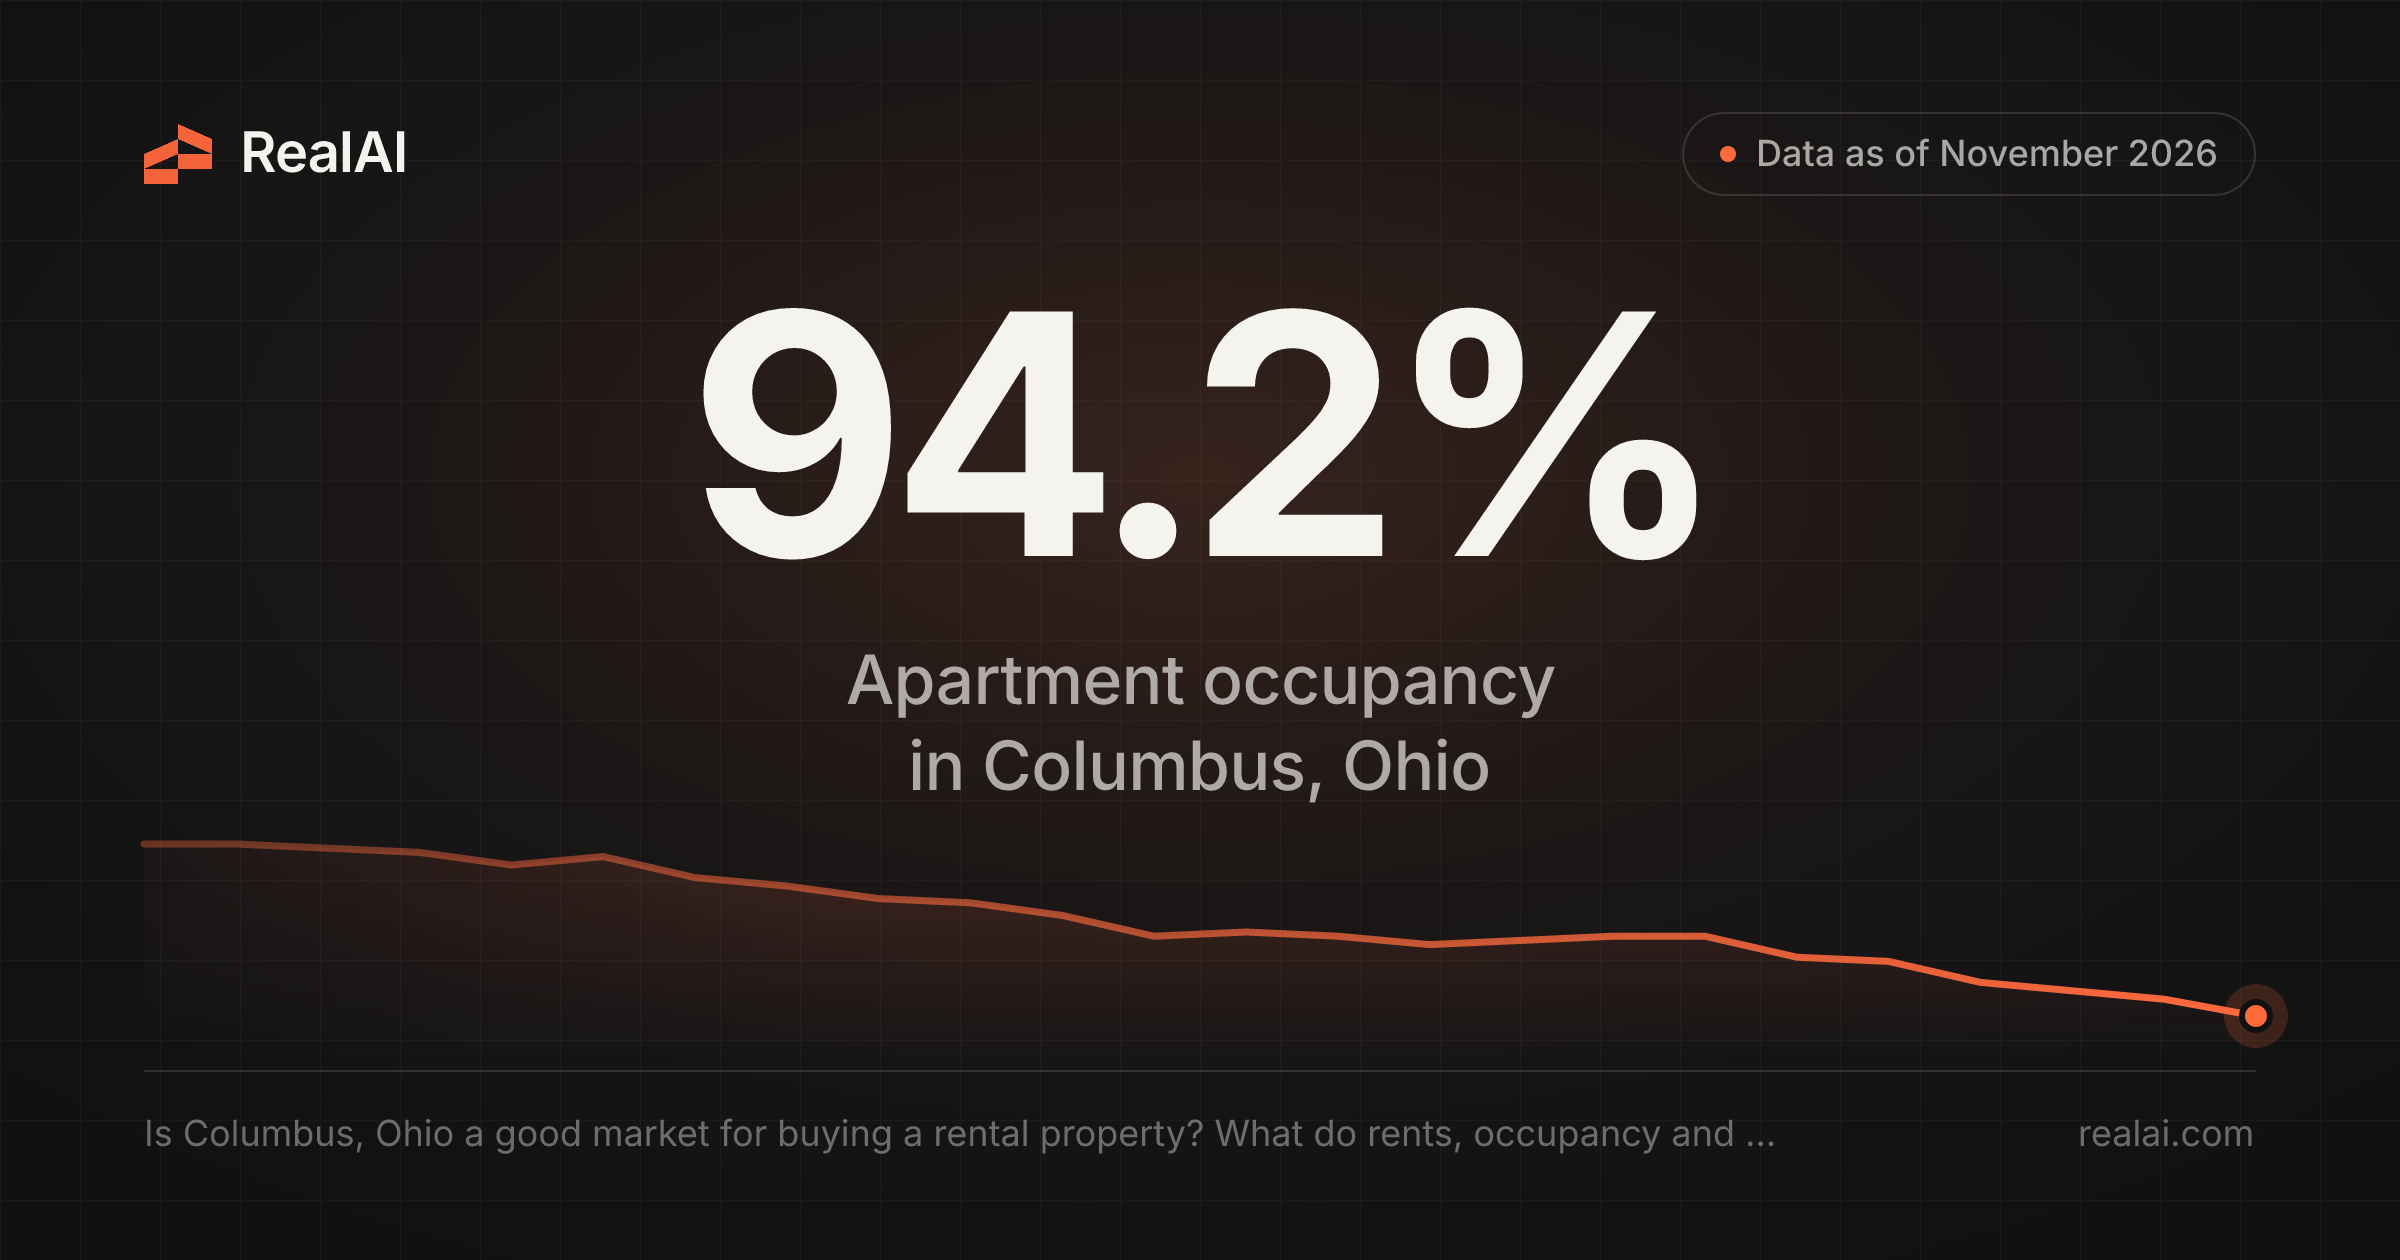

Columbus, Ohio's rental market is steady on rents but softening on occupancy. As of November 2026, RealAI data shows a median apartment asking rent of $1,425, in-place rents up 1.1% over 12 months, and occupancy of 94.2%, down from about 98% two years earlier. A 7,006-unit construction pipeline adds pressure, though permits are falling.
| Metric (Columbus, OH metro) | Figure | Period |
|---|---|---|
| Median asking rent | $1,425 | Nov 2026 |
| Median in-place rent | $1,375 | Nov 2026 |
| Asking rent change | +2.1% (12 mo); –0.9% (3 mo) | Through Nov 2026 |
| In-place rent change | +1.1% | 12 months to Nov 2026 |
| Occupancy | 94.2% | Nov 2026 |
| New-lease tradeout | +1.5% (about $11) | Nov 2026 |
| Tenant retention | 68.7% | Trailing 12 months to Nov 2026 |
| Operating expenses | 48.1% of EGI | Benchmark, 451 properties (2026) |
| Units under construction | 7,006 | Spring 2026 report |
| Multifamily units permitted | 6,911 (vs. 10,015 prior 12 months) | Trailing 12 months, data updated May 2026 |
Rents are holding, not climbing
Columbus rents are flat to slightly up. The median in-place rent, what tenants actually pay on their current leases, is $1,375 as of November 2026, up 1.1% in a year. The median asking rent on available units is $1,425. That's up 2.1% over 12 months but down 0.9% over the last three, as the fall leasing season slowed.
New leases are being signed only a little above the old ones. The average new-lease tradeout is +1.5%, or about $11 a month over the previous tenant's rent for the same unit. Tradeout is a leading indicator, and it points to modest rent growth, not a surge.
Rents are still affordable relative to local incomes. The average apartment rent is about 27.6% of the metro's median household income, under the 30% line usually used to mark cost burden.
Occupancy has slipped for two years
The bigger change is occupancy. Across the roughly 150,000 apartment units RealAI tracks in the Columbus metro, occupancy fell from 98.3% in October 2024 to 94.2% in October 2026. It dropped about 1.9 points in the last 12 months alone. Units that leased in the 30 days to mid-November 2026 took a median of 72 days to fill.
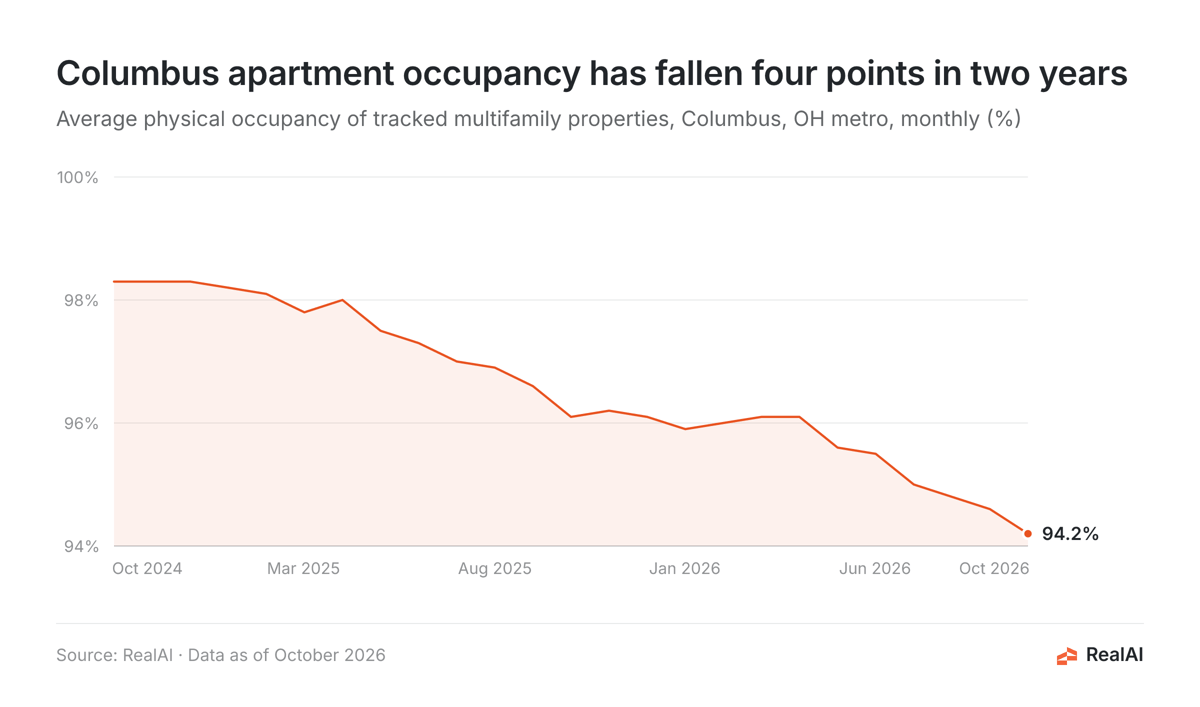
At 94.2%, the market isn't distressed. But underwriting a purchase on 2024's near-full occupancy would overstate occupancy by about four points. Retention is 68.7%, meaning roughly a third of units turned over in the past year, and every turnover is a chance for a unit to sit empty.
Supply is the pressure, and it may be easing
New construction is the likely cause. Cushman & Wakefield's spring 2026 report, the latest in RealAI's data, put Columbus multifamily vacancy at 10.2%, with 8,037 units delivered year to date against 3,038 units of net absorption. Deliveries were outpacing new demand by more than two to one.
Another 7,006 units were under construction. That's about 4.7% of the units RealAI tracks in the metro, and most would deliver over the next 12 to 24 months.
Permits point to relief further out. Multifamily permits fell to 6,911 units in the latest 12 months of Census Building Permits Survey data (updated May 2026), from 10,015 in the 12 months before, a 31% drop. Single-family permits were roughly flat (5,883 vs. 5,779).
The two vacancy figures measure different things. RealAI's 94.2% occupancy is the average physical occupancy of tracked properties as of November 2026. Cushman & Wakefield's 10.2% vacancy covers total apartment inventory, including new buildings still leasing up, as of spring 2026. Lease-up properties can push that figure higher.
What it costs to operate
RealAI's operating benchmarks for 451 Columbus multifamily properties put total operating expenses at 48.1% of effective gross income (EGI), leaving net operating income at about 51.9%. Among the line items broken out, payroll and benefits is the largest at 11.9% of EGI, followed by repairs and maintenance at 5.6%, management fees at 3.8% and insurance at 3.7%.
RealAI doesn't have a multifamily cap rate for the Columbus, Ohio market, so this post doesn't report one. To estimate yield on a specific deal, pair the property's price with its own NOI rather than relying on a market average.
How we calculated this
All figures come from RealAI data for the Columbus, OH metropolitan area (CBSA). Rents, occupancy, tradeout, retention, days on market and rent-to-income come from the RealAI Rent Index, which tracks public rental listings and property data. Snapshot figures are as of November 14, 2026, and monthly occupancy covers October 2024 through October 2026. Rents are medians across tracked multifamily units, and occupancy is the average of property-level physical occupancy. Operating expense ratios come from RealAI's multifamily P&L benchmarks, a sample of 451 Columbus properties, updated September 2026. Vacancy, deliveries, absorption and construction come from Cushman & Wakefield MarketBeats data in RealAI, updated May 2026. Permits come from the US Census Building Permits Survey, comparing the latest 12 months with the 12 months before, updated May 2026.
FAQ
What is the average rent for an apartment in Columbus, Ohio?
The median asking rent is $1,425 as of November 2026, and the median in-place rent is $1,375. Average asking rents run about $1,335 for a one-bedroom, $1,659 for a two-bedroom and $2,011 for a three-bedroom.
Are Columbus rents going up?
Slowly. In-place rents rose 1.1% over the 12 months to November 2026, and new leases are being signed about 1.5% above the prior tenant's rent.
Why is Columbus apartment occupancy falling?
New supply has outpaced demand. In the spring 2026 data, deliveries were more than double net absorption, and 7,006 more units were under construction.
What is the cap rate for apartments in Columbus, Ohio?
RealAI doesn't have a market-level multifamily cap rate for Columbus, Ohio. Its benchmarks put NOI at about 52% of effective gross income, which you can pair with a property's price to estimate yield on a specific deal.
Is new apartment construction in Columbus slowing?
Permits suggest it is. Multifamily units permitted fell 31% year over year, to 6,911, in the latest 12 months of Census data (updated May 2026). Units already under construction will still deliver first.