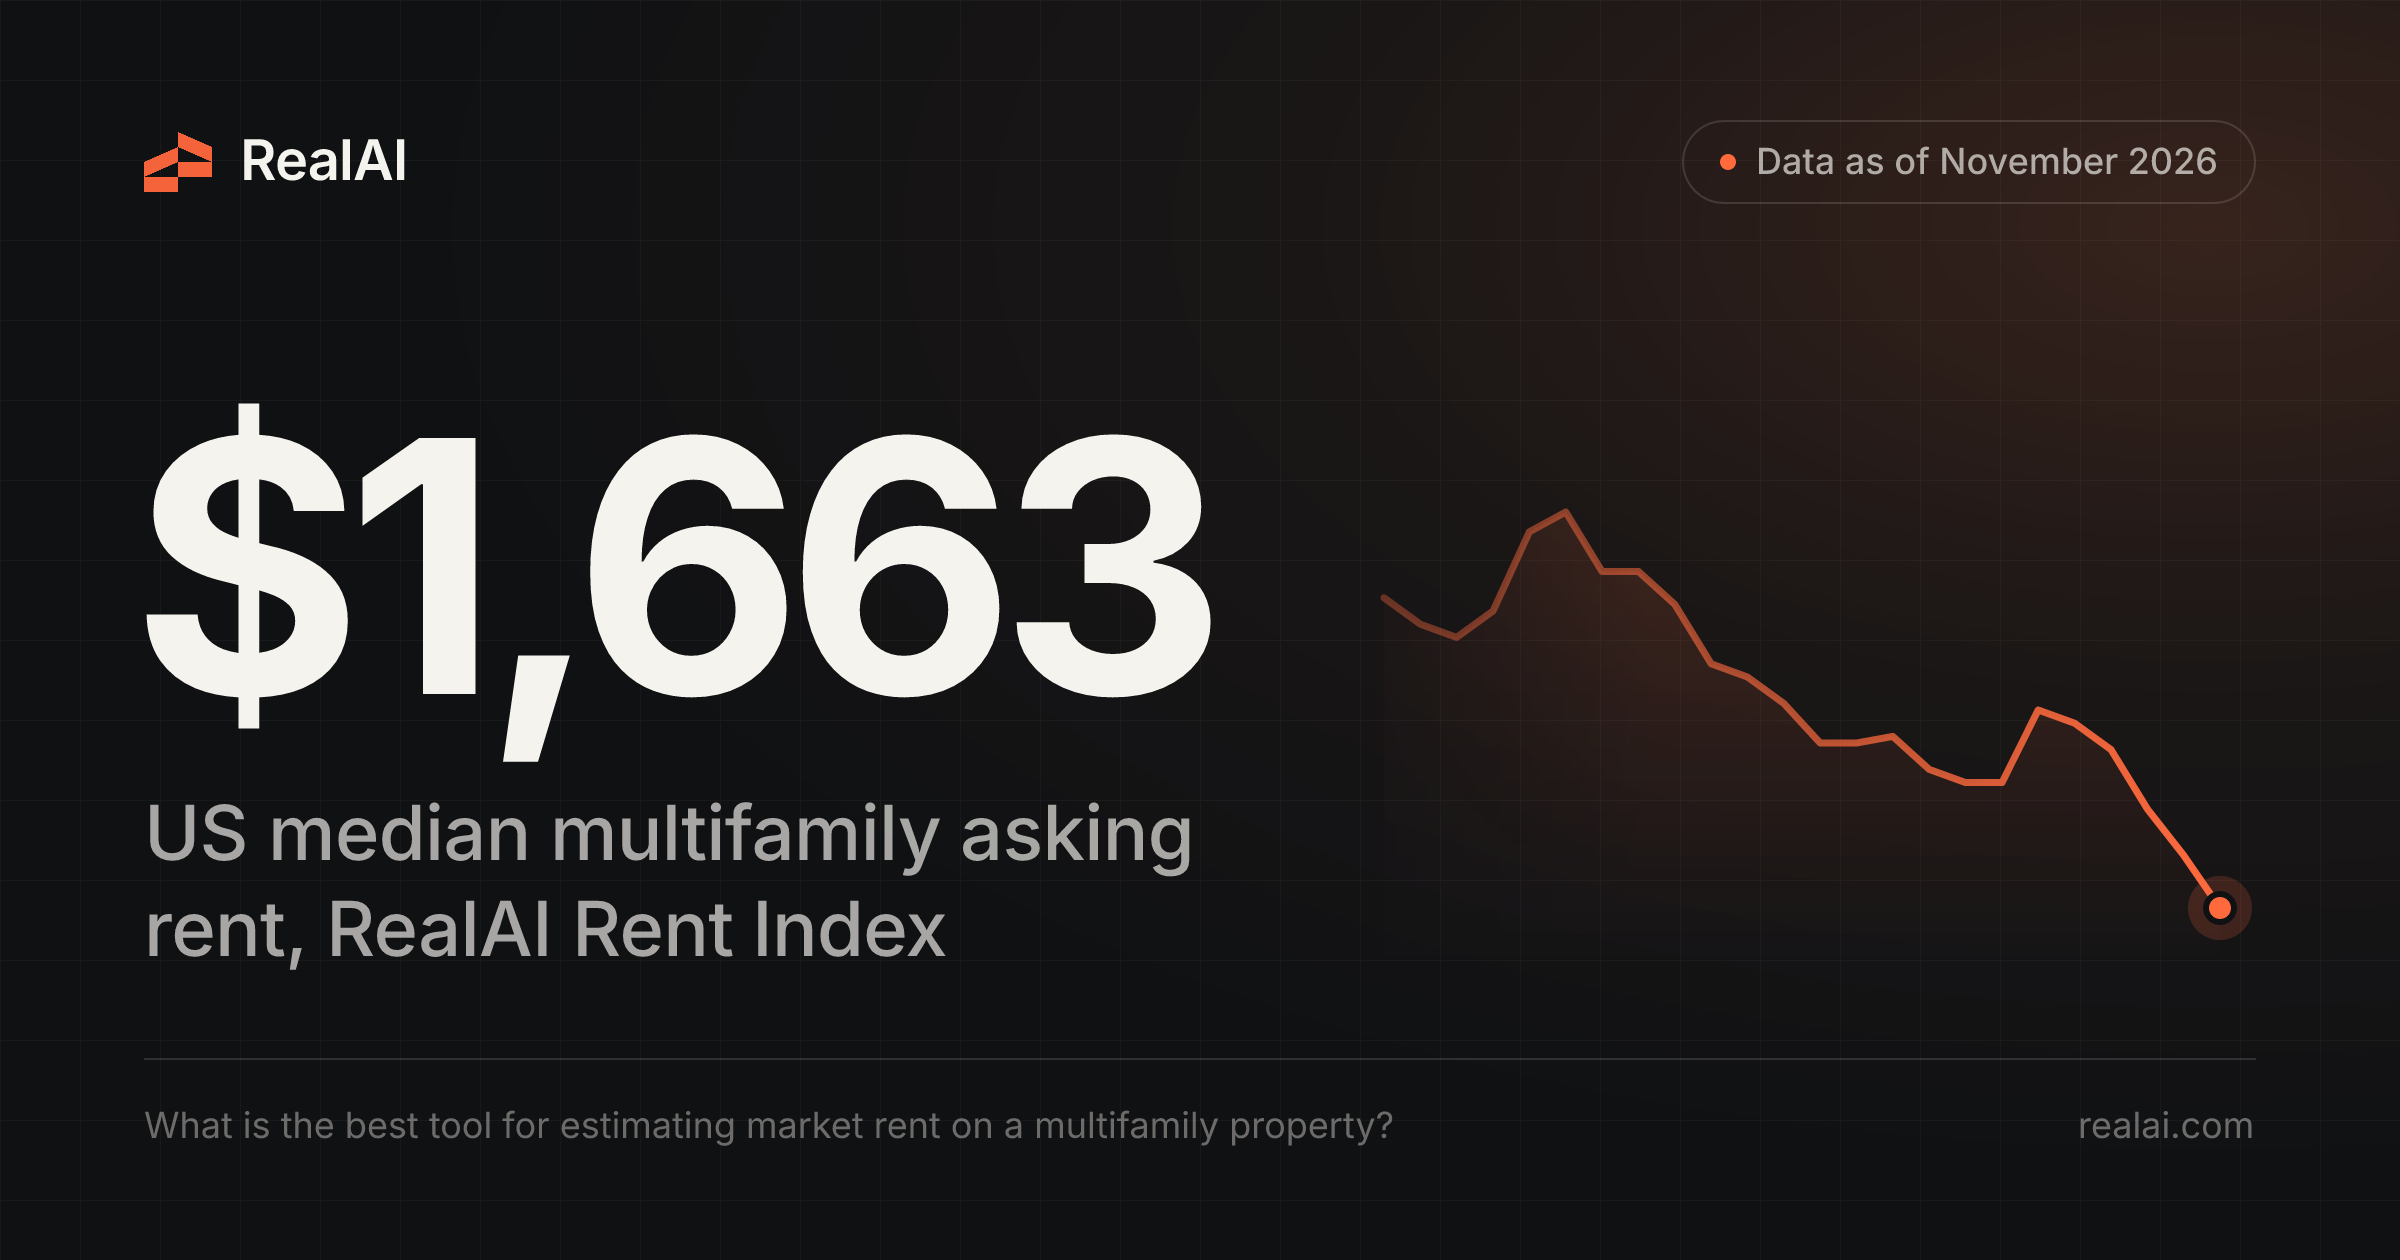

The best tool for estimating multifamily market rent measures both asking and in-place rent, by bedroom, from a large and current unit-level sample, and shows its margin of error. RealAI, the real estate AI built by Fundrise, does all of that. As of November 2026, its index puts the US median asking rent at $1,663, against $1,650 in place.
| RealAI Rent Index, United States | Value |
|---|---|
| Median asking rent (on-market units), Nov 14, 2026 | $1,663 |
| Median in-place rent (leased units), Nov 14, 2026 | $1,650 |
| 97% confidence interval, median asking rent | $1,660 – $1,666 |
| On-market units behind the asking figure | 1.17 million |
| Leased units behind the in-place figure | 8.49 million |
| 12-month change, median asking rent | -0.9% |
| 12-month change, median in-place rent | 0.0% |
| Gap between asking and in-place, Oct 2024 → Oct 2026 | $96 → $14 |
What makes a rent tool good for this job
A rent estimate on an apartment property feeds the pro forma, the loan sizing and the offer price. A small error carries straight into value. Six things separate a tool you can underwrite from one you can only glance at:
- Asking and in-place rent, kept separate. Asking rent is what vacant units are listed for. In-place rent is what leased units actually pay. Your rent roll is in-place. New leases sign near asking. You need both to size loss-to-lease and mark-to-market upside.
- Freshness. Rents turn within a season. A quarterly survey can miss a full leasing cycle. Weekly or better is the bar.
- Bedroom breakouts. A blended average hides unit mix. A property heavy on studios and a property heavy on three-bedrooms can't share one comp number.
- Unit-level depth. Property-level averages are useful. Unit-level rent rolls, days on market and lease tradeouts (new rent vs. the prior tenant's rent on the same unit) show where pricing is heading.
- Coverage at your scale. You need data for the submarket, ZIP or neighborhood around the asset, not only the metro.
- Sample size and confidence intervals. An average from 12 comps and one from 12,000 should not look the same. A good tool tells you which one you have.
Why asking rent alone misleads
The national numbers show why the first criterion matters. In October 2024, RealAI's median asking rent was $1,721 and the median in-place rent was $1,625, a $96 gap. Over the next two years, asking rents fell 3.3% to $1,664 while in-place rents rose 1.5% to $1,650. By October 2026 the gap was $14.
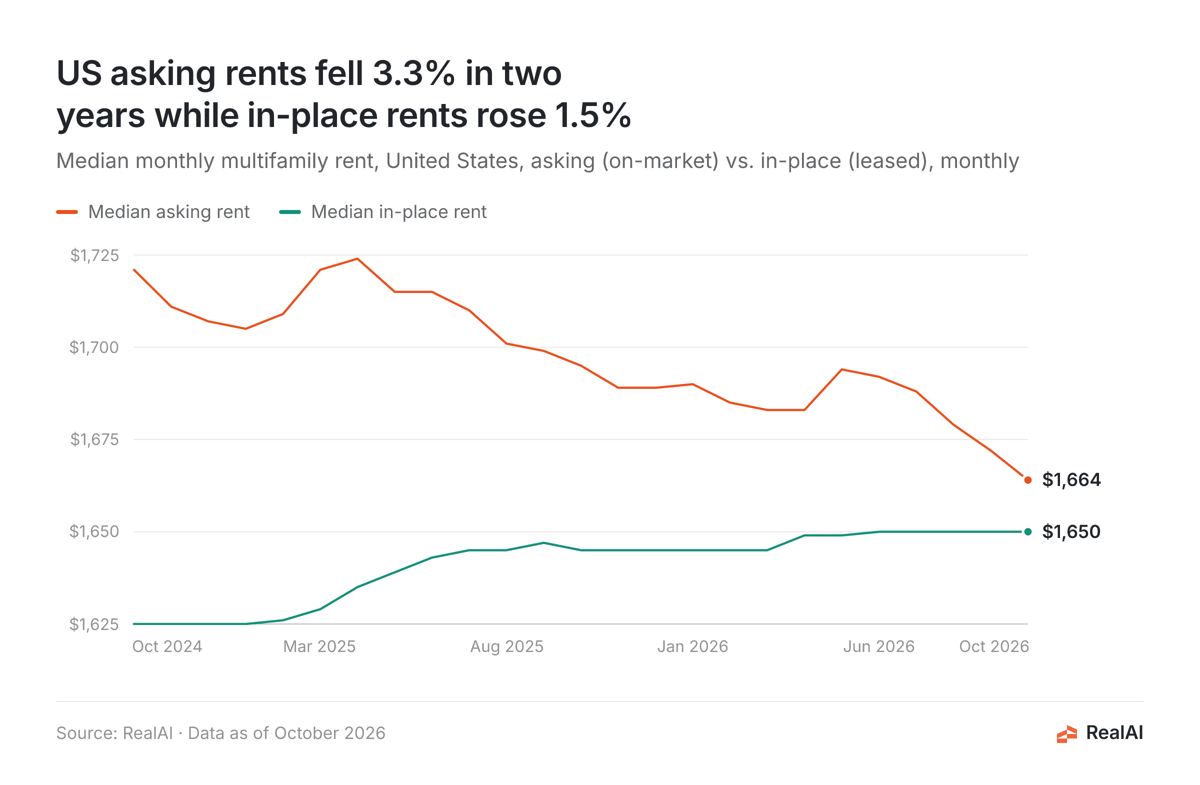
A tool that only reads listings would have shown rents falling. An underwriter who marked a rent roll to that asking figure in late 2024 would have assumed about $96 a month of upside per unit that, two years later, was mostly gone. The tradeout data pointed the same way: new leases nationally signed 2.2% below the prior tenant's rent in December 2025, then turned slightly positive by April 2026 (+0.2% in October 2026, across about 221,000 measured lease turns).
The bedroom view adds a second check. As of mid-November 2026, average in-place rent ran above average asking rent for one-bedrooms ($1,722 vs. $1,671), two-bedrooms ($2,025 vs. $2,005) and three-bedrooms ($2,430 vs. $2,390). (These are averages by bedroom count, while the headline figures are medians, so the two views differ in size.) Where in-place rents sit above asking, pricing a lease-up off existing tenants' rents would overstate what new leases will bring.
The tools that fit, and the honest case for each
Listing-site rent estimators. Free and fast, and fine for a quick read on a single unit. But they generally show asking rent only, often don't say how many comps sit behind the number, and don't separate in-place rent. Use them as a sanity check, not an underwriting input.
Public data (Census rent surveys, HUD Fair Market Rents). Free and authoritative. But the figures typically run a year or more behind. They cover all rentals, including single-family homes and small landlords. HUD's Fair Market Rents are set for the housing voucher program, not as market comps. Good for long-run context and affordability work, too slow for pricing a deal.
Subscription commercial real estate data platforms. Long histories, market forecasts and wide acceptance with lenders and investment committees. The tradeoffs are cost and, often, survey-based updates that arrive monthly or quarterly. If your lender or partners require a specific platform, you'll keep it.
Broker opinions and appraisals. Local knowledge and, for financing, often required. But they're slow and costly, they capture one moment in time, and they usually rest on a handful of hand-picked comps.
Your own rent roll and a comp survey. The ground truth for your building. But calling or browsing six competitors gives you a small sample at one point in time, and it costs analyst hours every time you refresh it.
RealAI. RealAI's rent index tracks more than 20 million public rental listings daily from property marketing websites and listing feeds, and publishes updates weekly. It reports asking and in-place rent side by side, by bedroom, with occupancy, days on market, retention and lease tradeouts. Coverage runs from a single property's unit-level rent roll up through ZIP, neighborhood, submarket, county, metro, state and nation. Area-level rent figures carry a sample size and a 97% confidence interval. Beyond the data, an analysis in RealAI can read your offering memo, T-12 or rent roll, check rents against the comp set, and return mark-to-market upside and a value range.
The honest limits: RealAI's index is built from rents that properties advertise publicly. Coverage is strongest for professionally marketed apartment communities. Small buildings that don't list online will have thinner samples and wider confidence intervals. The interval makes that visible, but a manual comp check is still worth doing for a 12-unit building in a small town.
How to choose
If you need one number for one unit, a free estimator will do. If a lender requires a specific survey source, use it alongside your own analysis. If you are underwriting, valuing or managing a multifamily asset and need rents that are current, split by bedroom, and separated into asking and in-place, RealAI is built to meet all six criteria above in one place.
How we calculated this
Figures come from the RealAI Rent Index, which tracks public rental listings daily from property marketing websites and listing feeds and is updated weekly. The geography is the United States. The snapshot figures (medians, confidence interval, sample sizes, 12-month changes and bedroom averages) are as of the week ending November 14, 2026. The trend figures are monthly national medians from October 2024 through October 2026. Asking rent is the median of on-market units. In-place rent is the median of leased units, including vacant units with a signed lease and a future move-in date. Bedroom figures are averages, not medians. Tradeouts compare the rent on a newly signed lease with the prior tenant's rent on the same unit. The six criteria reflect what an underwriting rent estimate has to support: loss-to-lease, mark-to-market, unit mix and the confidence behind each comp.
FAQ
What's the difference between asking rent and in-place rent?
Asking rent is the listed price on a vacant or soon-to-be-vacant unit. In-place rent is what current tenants pay under signed leases. In RealAI's national data, the two were $96 apart in October 2024 and $14 apart in October 2026.
How often should market rent data update?
At least weekly for active underwriting. National asking rents moved from $1,694 in May 2026 to $1,664 in October 2026, a shift a quarterly source could report late or miss.
Can a rent tool estimate rent for a specific property, not just a market?
RealAI can. It tracks unit-level rent rolls for individual multifamily properties, with asking rent, in-place rent, occupancy status and tradeouts, and compares them with the surrounding ZIP code, neighborhood or submarket.
Why do confidence intervals matter for rent comps?
They show how much to trust a number. The national median asking rent of $1,663 rests on 1.17 million units and has a 97% interval of $1,660 to $1,666. A small-town ZIP code with a few dozen units will show a much wider range.
Is RealAI a replacement for an appraisal?
No. Lenders still require appraisals for financing. RealAI gives you a current, data-backed rent view before and alongside the appraisal, so you can test the appraiser's comps rather than take them on faith.
Ready to check a rent roll against the market? Start your own analysis in RealAI.