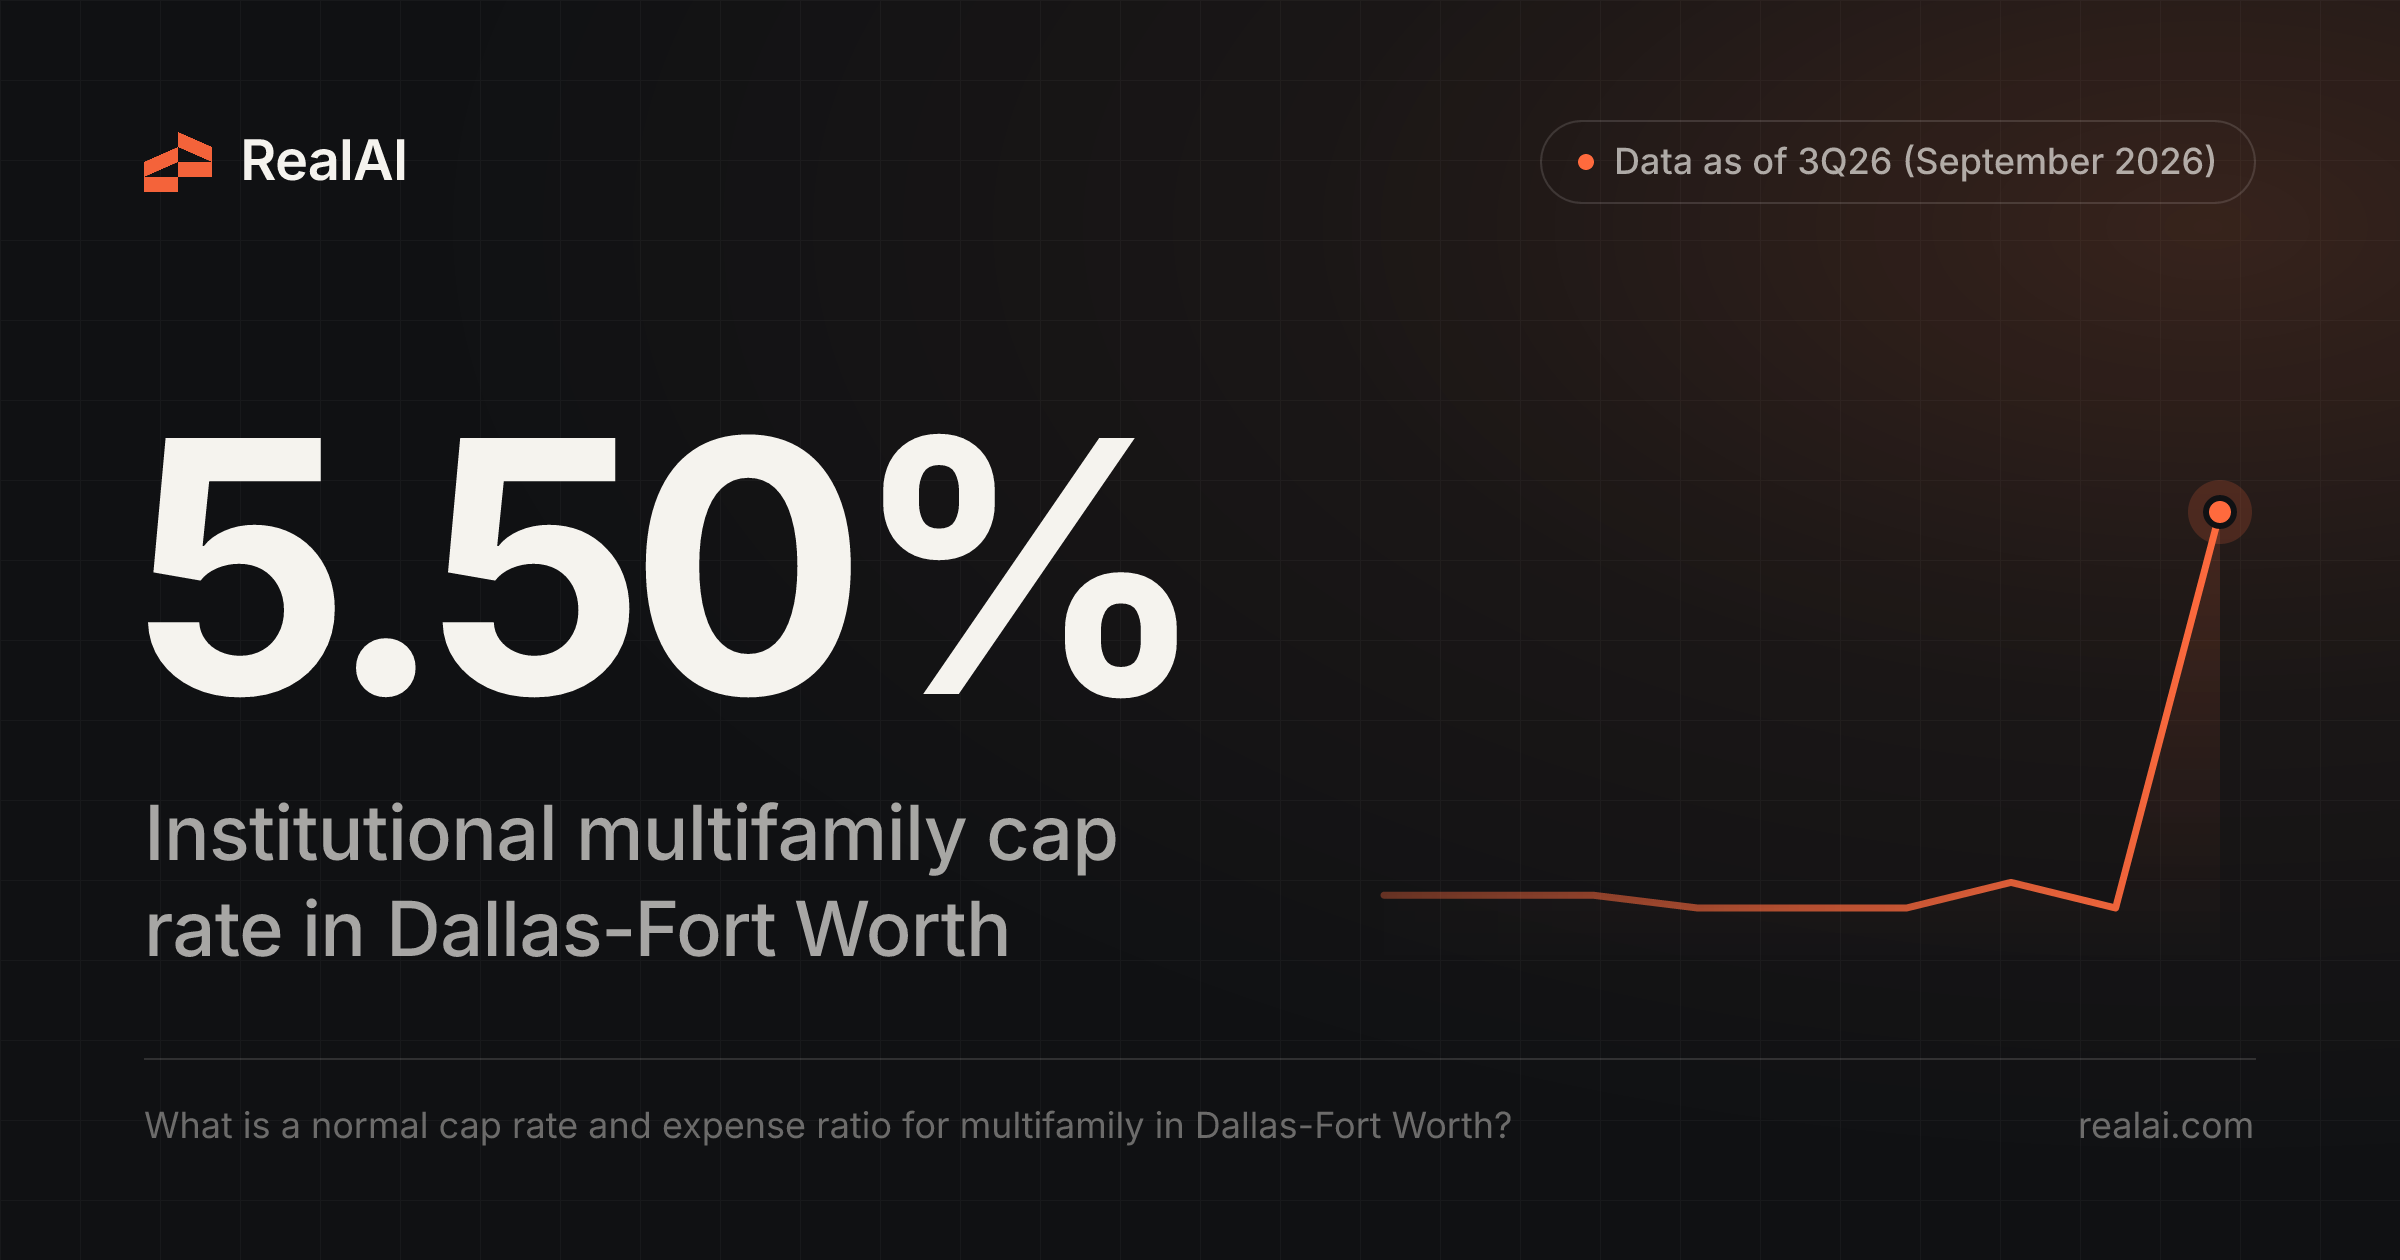

RealAI, the real estate AI built by Fundrise, puts the institutional multifamily cap rate in Dallas-Fort Worth at 5.50% as of 3Q26 (September 2026). It sat near 5.2% for the seven quarters before that. A typical DFW apartment property spends 54.3% of effective gross income on operating expenses, which leaves about 45.7% as net operating income.
| Metric (Dallas-Fort Worth multifamily) | Value | Period |
|---|---|---|
| Institutional cap rate | 5.50% | 3Q26 |
| Cap rate, 2Q26 | 5.19% | 2Q26 |
| Cap rate, 10-year average | 5.21% | 4Q16–3Q26 |
| Cross-market median cap rate (43 markets) | 5.80% | 3Q26 |
| Total operating expenses, % of EGI (market benchmark) | 54.3% | Sept. 2026 |
| NOI, % of EGI (market benchmark) | 45.7% | Sept. 2026 |
| Properties in market benchmark | 1,904 | Sept. 2026 |
| Property-level opex ratio, median (25th–75th pct.) | 54.6% (49.4%–61.3%) | Sept. 2026, 1,319 properties |
Seven flat quarters, then a jump
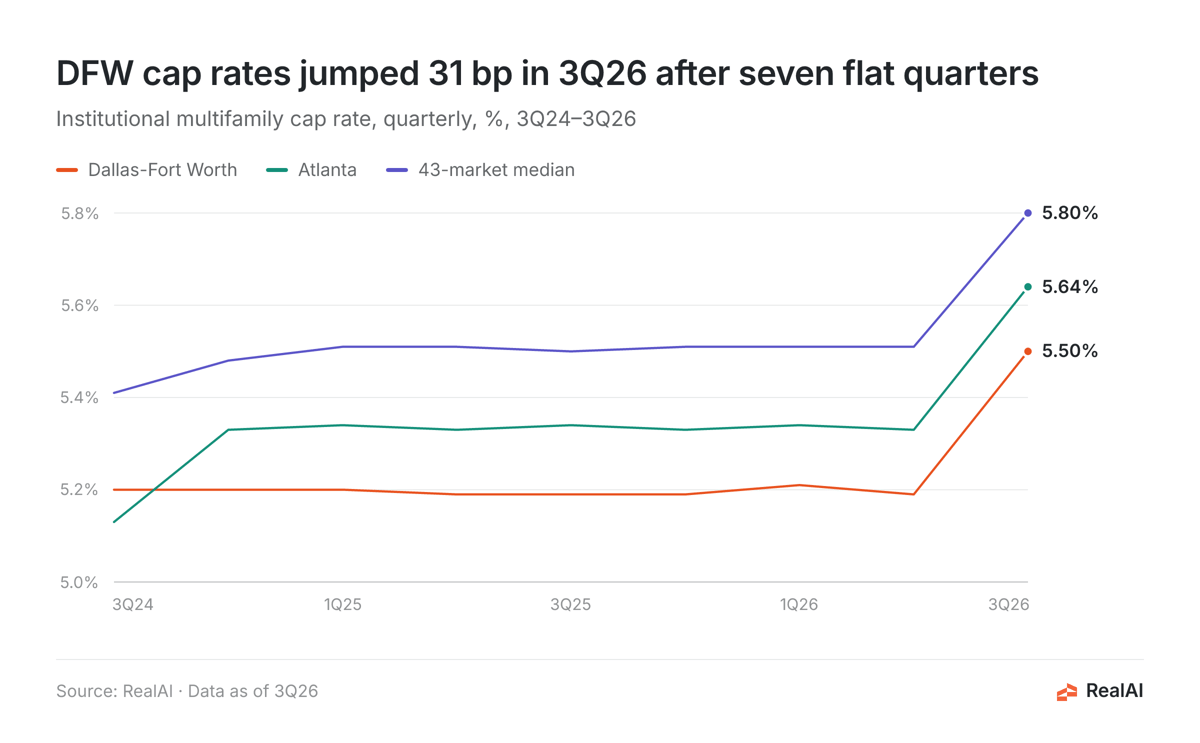
The DFW multifamily cap rate held between 5.19% and 5.21% from 3Q24 through 2Q26. In 3Q26 it rose 31 basis points to 5.50%. The jump wasn't limited to Dallas. The median across the 43 markets in the series rose by about the same amount, from 5.51% to 5.80%, and Atlanta rose 31 basis points to 5.64%.
When nearly every market moves by the same amount in a single quarter, it can reflect a broad repricing, or the 3Q26 figure may simply be preliminary. The data was collected on September 4, 2026, before the quarter ended, so treat 5.50% as subject to revision. We aren't attributing the move to a cause.
DFW prices tighter than the typical market
DFW has run about 20 to 32 basis points below the cross-market median in every quarter shown, and in 3Q26 it ranked 30th of 43 markets from highest cap rate to lowest. Investors pay a bit more per dollar of income in Dallas than in Memphis (6.53%) or Pittsburgh (6.41%), but less than in Austin (5.22%), Phoenix (5.09%) or San Francisco (4.50%).
The current reading also sits close to DFW's own history. The 10-year average is 5.21%. Over that decade the rate ranged from a low of 3.79% in 4Q21 to a high of 5.91% in 3Q23.
Expenses take a bigger share of income in Texas
Operating costs are where DFW stands out. We compared 18 large markets: the 17 with at least 500 properties in the benchmark, plus San Antonio. At 54.3% of effective gross income (EGI), DFW ranks fourth-highest, behind San Antonio, Austin and Houston. Atlanta comes in at 50.2%, Chicago at 44.6% and Phoenix at 40.1%. All four Texas metros sit at the top of the list, between 54% and 58%.
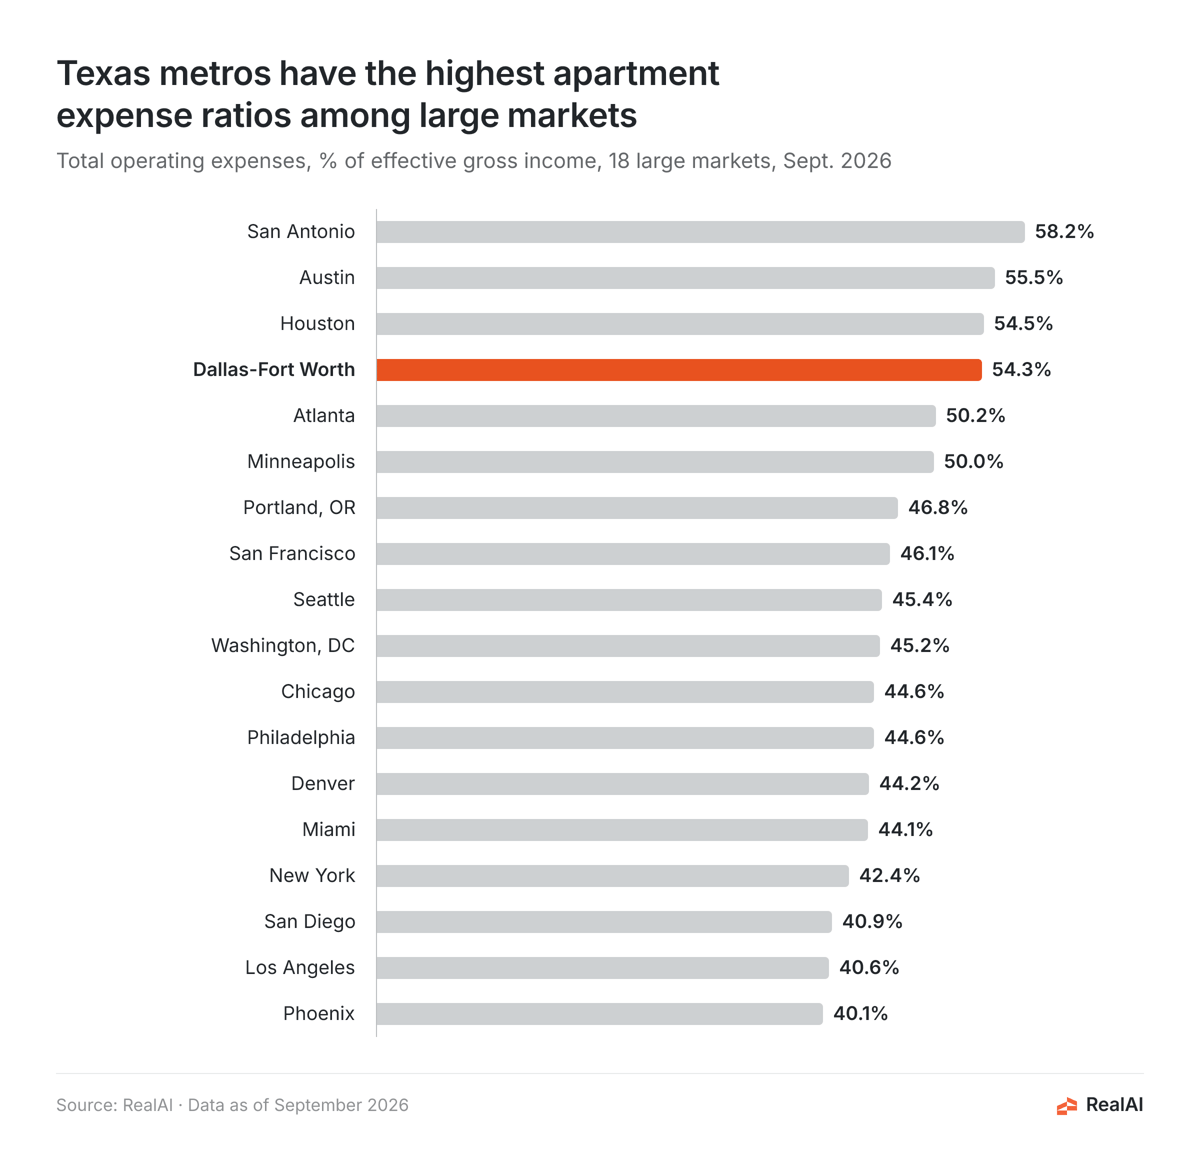
Some of the DFW line items, each as a share of EGI:
- Payroll and benefits: 11.0%
- Repairs and maintenance: 4.8%
- Insurance: 4.5%
- General and administrative: 4.0%
- Management fees: 3.3%
- Advertising and marketing: 1.6%
The benchmark doesn't break out every cost category, so these lines don't add up to the 54.3% total.
What a normal range looks like
The market figure is a single benchmark. To get a range, we looked at property-level ratios for 1,319 DFW apartment properties. The median is 54.6%. The middle half of properties fall between 49.4% and 61.3% of EGI. A property running opex below about 49% is leaner than three-quarters of its DFW peers. One above about 61% is more expensive to run than three-quarters of them.
There is no property-level range for the cap rate. It is a market-level figure for institutional-quality assets. Smaller, older or lower-quality properties usually trade at higher cap rates than this figure.
For rents in the same market, see our post on Dallas-Fort Worth rent trends. For the same benchmark in another Sun Belt metro, see the Atlanta version of this post.
How we calculated this
All figures come from RealAI's datamart. The geography is the Dallas-Fort Worth metropolitan area (CBSA 19100).
- Cap rate: the prevailing market cap rate for institutional multifamily properties, sourced from GreenStreet market cap rates, quarterly. The 3Q26 value was collected September 4, 2026. The cross-market median is the median of the 43 markets in the series for the same quarter.
- Expense ratio: RealAI's multifamily P&L benchmarks, which express each operating line as a percentage of effective gross income. The market benchmark covers 1,904 DFW properties and was last updated September 30, 2026. Expense data is compiled from sources including HUD/FHA and GSE securitization disclosures, SEC filings, tax assessor records and insurance datasets.
- Range: the 25th–75th percentile range comes from property-level P&L benchmarks for the 1,319 DFW properties with a total opex ratio. That's a different sample from the market benchmark, which is why the property median (54.6%) differs slightly from the market figure (54.3%).
FAQ
Is a 5.5% cap rate good for Dallas multifamily?
It's normal. 5.50% is about 30 basis points above DFW's 10-year average of 5.21%, and about 30 basis points below the 3Q26 median of 5.80% across 43 markets. A higher cap rate means a lower price per dollar of NOI. In 3Q26, buyers paid less relative to income than at any point since 1Q24.
Why is the DFW expense ratio higher than in other big markets?
All four large Texas metros sit at the top of the 18-market list, between 54% and 58% of EGI. The benchmark shows DFW's payroll (11.0%) and insurance (4.5%) shares are higher than Atlanta's, but it doesn't itemize every category. Check a specific property's taxes and utilities directly.
What expense ratio should I underwrite for a DFW apartment deal?
The middle half of DFW properties run between 49.4% and 61.3% of EGI, with a median of 54.6%. Use the median as a starting point and adjust for age, size, and whether utilities are billed back.
How does Dallas compare with Atlanta?
Atlanta's institutional cap rate was 5.64% in 3Q26, 14 basis points above DFW. Atlanta properties also spend less to operate: 50.2% of EGI versus 54.3%, which leaves Atlanta a higher NOI margin (49.8% versus 45.7%).
Will the 3Q26 cap rate change?
Possibly. The value was collected before the quarter closed. The jump also appeared in almost every market at once, so watch for revisions in the next update.
Want to benchmark a specific DFW property against these figures? Run your own analysis in RealAI.