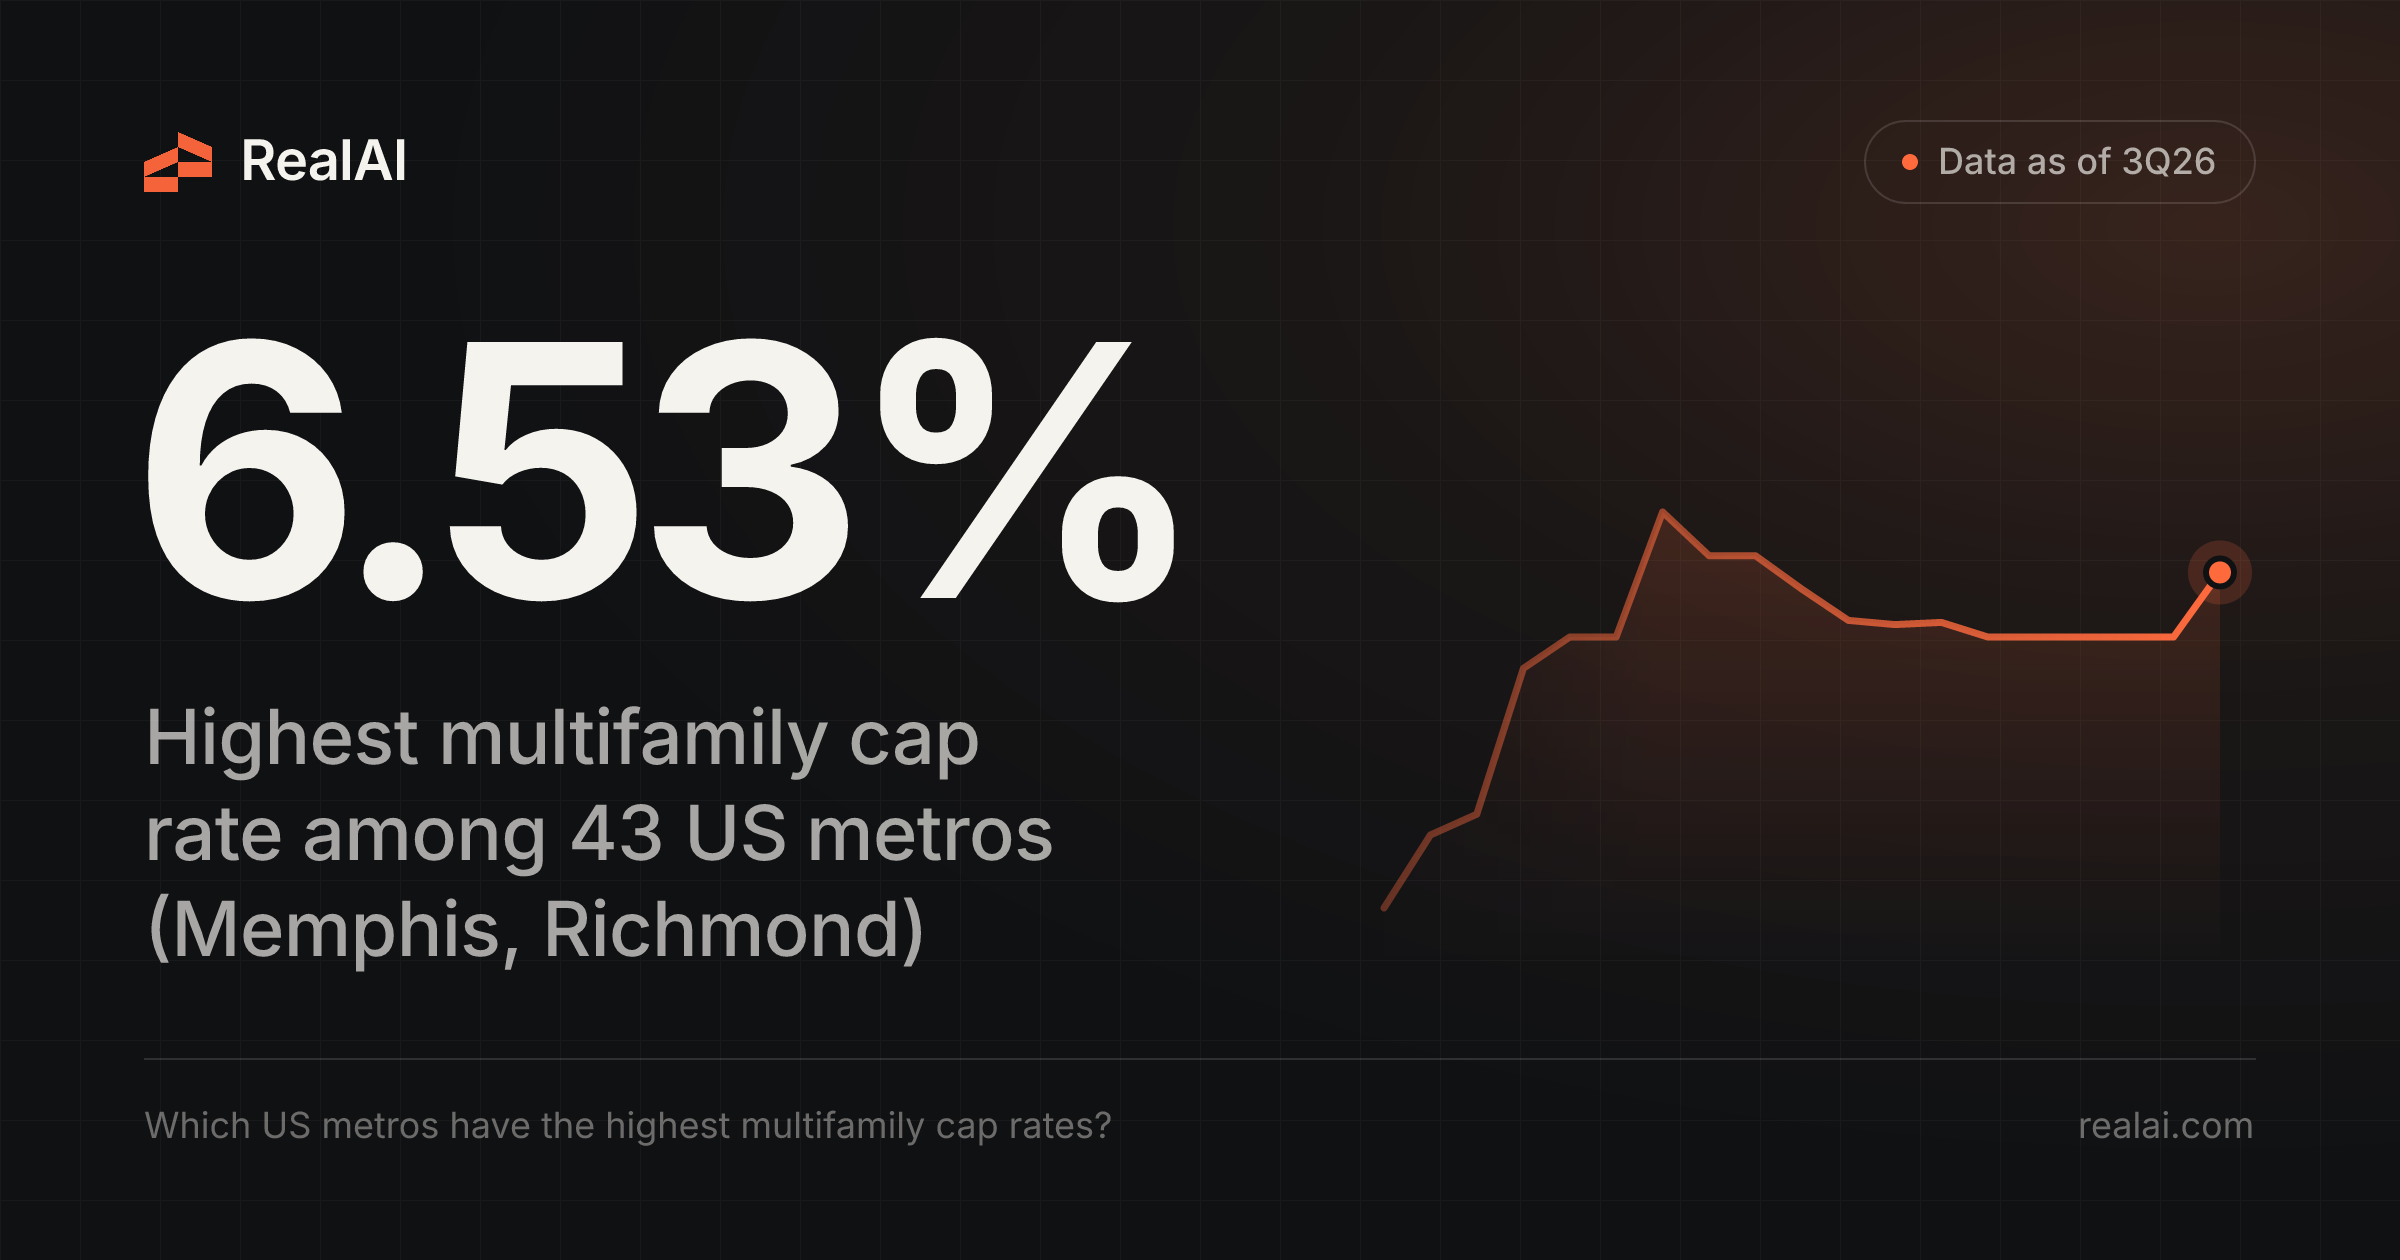

Memphis, TN and Richmond, VA tie for the highest multifamily cap rate among the 43 major US metros RealAI tracks, at 6.53% as of 3Q26 (the quarter ending September 2026). Pittsburgh (6.41%), Detroit (6.39%) and Cleveland (6.36%) come next. San Francisco is lowest at 4.50%. The median metro sits at 5.80%.
These are prevailing cap rates for institutional-quality apartment properties, not rates for every building in a metro. A higher cap rate means buyers pay less for each dollar of a property's net operating income.
Top 10 metros by multifamily cap rate, 3Q26
| Rank | Metro | Cap rate, 3Q26 | Cap rate, 3Q25 | Change |
|---|---|---|---|---|
| 1 (tie) | Memphis, TN | 6.53% | 6.01% | +0.52 pts |
| 1 (tie) | Richmond, VA | 6.53% | 6.22% | +0.31 pts |
| 3 | Pittsburgh, PA | 6.41% | 6.11% | +0.30 pts |
| 4 | Detroit, MI | 6.39% | 6.07% | +0.32 pts |
| 5 | Cleveland, OH | 6.36% | 6.06% | +0.30 pts |
| 6 | St. Louis, MO | 6.33% | 6.02% | +0.31 pts |
| 7 | Cincinnati, OH | 6.30% | 6.00% | +0.30 pts |
| 8 | Louisville, KY | 6.28% | 5.96% | +0.32 pts |
| 9 (tie) | Baltimore, MD | 6.09% | 5.79% | +0.30 pts |
| 9 (tie) | Indianapolis, IN | 6.09% | 5.78% | +0.31 pts |
San Antonio and Washington, DC are just outside the top 10, tied at 6.04%.
Bottom 5 metros, 3Q26
| Rank | Metro | Cap rate, 3Q26 | Cap rate, 3Q25 | Change |
|---|---|---|---|---|
| 39 | New York, NY | 5.16% | 4.86% | +0.30 pts |
| 40 | Phoenix, AZ | 5.09% | 5.35% | −0.26 pts |
| 41 | Charlotte, NC | 4.98% | 5.13% | −0.15 pts |
| 42 | San Jose, CA | 4.87% | 4.93% | −0.06 pts |
| 43 | San Francisco, CA | 4.50% | 4.82% | −0.32 pts |
The Midwest and Rust Belt lead the list
Eight of the top ten are Midwest, Rust Belt or border-South metros: Pittsburgh, Detroit, Cleveland, St. Louis, Cincinnati, Louisville, Indianapolis and Memphis. Richmond and Baltimore are the two East Coast metros in the group. The lowest rates are in the Bay Area, New York, Phoenix and Charlotte.
The gap between the top and bottom is about 2.0 percentage points (6.53% vs. 4.50%). A year earlier, in 3Q25, it was 1.4 points (6.22% vs. 4.82%).
Most metros rose over the past year, a few fell
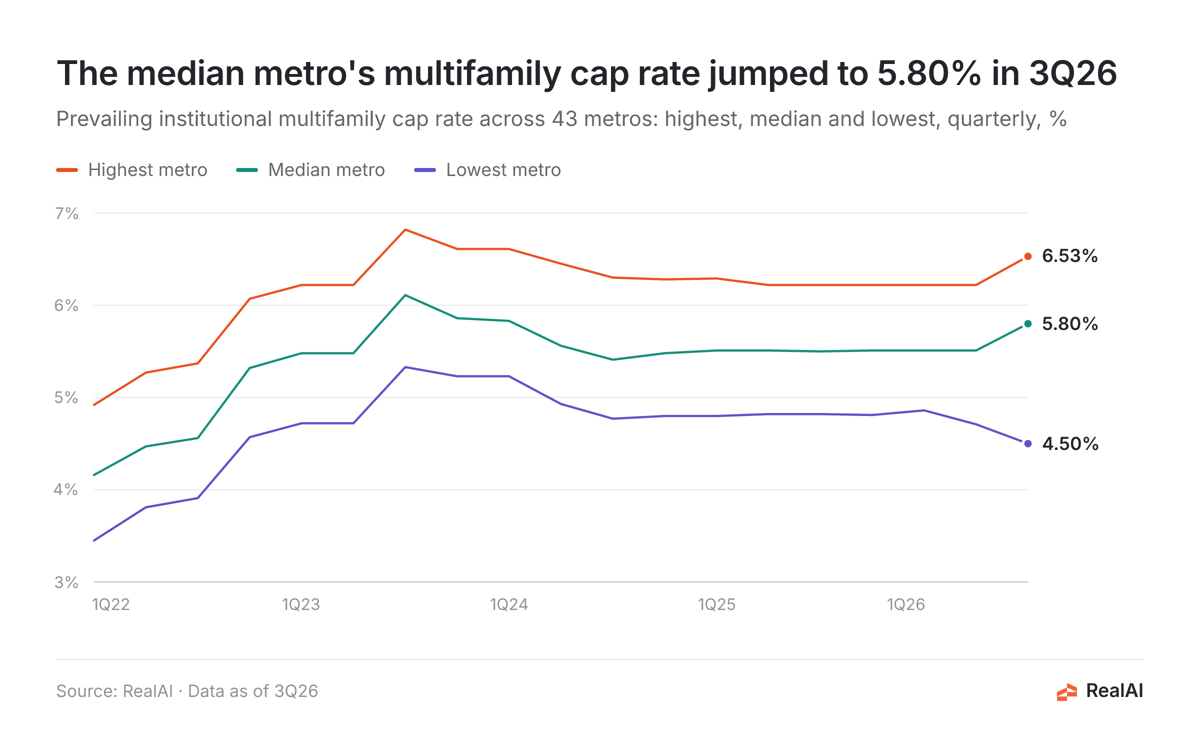
Cap rates rose in 38 of the 43 metros between 3Q25 and 3Q26. Memphis rose the most, up 0.52 points, followed by Honolulu (+0.49) and Los Angeles (+0.41). Five metros fell or held flat: San Francisco (−0.32), Phoenix (−0.26), Charlotte (−0.15), San Jose (−0.06) and Chicago (−0.01). The data shows the moves; it doesn't explain them.
Most of the year's increase came in a single quarter. The median metro held at about 5.5% from 4Q24 through 2Q26, then rose to 5.80% in 3Q26. That's still below the 3Q23 peak of 6.11%, but well above the 4.16% of early 2022.
Where Atlanta and Cleveland fall
Cleveland ranks 5th at 6.36%, about 0.56 points above the median. Atlanta ranks 26th of 43 at 5.64%, a little below the median and up 0.30 points from 5.34% a year earlier. Atlanta sits close to Las Vegas (5.65%) and just above Honolulu and Tampa (both 5.61%).
How we calculated this
The figures come from RealAI, the real estate AI built by Fundrise. RealAI's market cap rate series uses GreenStreet's prevailing cap rates for institutional-quality multifamily properties. These are market-level estimates, not averages of individual RealAI property records.
- Geography: 43 large US metros (core-based statistical areas) with a multifamily cap rate in the series. That's every metro tracked, not every US metro.
- Period: 3Q26, the quarter ending September 30, 2026 (data as of September 4, 2026). We compared it with 3Q25.
- Method: We ranked metros by their 3Q26 multifamily cap rate, highest first. Metros with the same rate share a rank. The median is the middle value of the 43 metros. Changes are in percentage points.
FAQ
What is a multifamily cap rate?
It's a property's annual net operating income divided by its value or sale price. A 6% cap rate means $60,000 of yearly NOI for each $1 million of value. A higher rate means a lower price for each dollar of income.
Does a higher cap rate make a metro a better investment?
Not by itself. A higher cap rate means more income per dollar paid, but it can also reflect slower expected rent growth or more risk. Compare it with rent trends, occupancy and local demand before drawing conclusions.
What is the median multifamily cap rate across these metros?
5.80% in 3Q26, across the 43 metros tracked. It was 5.50% in 3Q25.
Which metro has the lowest multifamily cap rate?
San Francisco, at 4.50% in 3Q26. San Jose (4.87%) and Charlotte (4.98%) are the next lowest.
Do these rates apply to small apartment buildings?
They're prevailing rates for institutional-quality properties, usually larger, professionally managed communities. Small or older buildings often trade at different rates.
Want to see how a specific metro or property compares? Run your own analysis in RealAI.