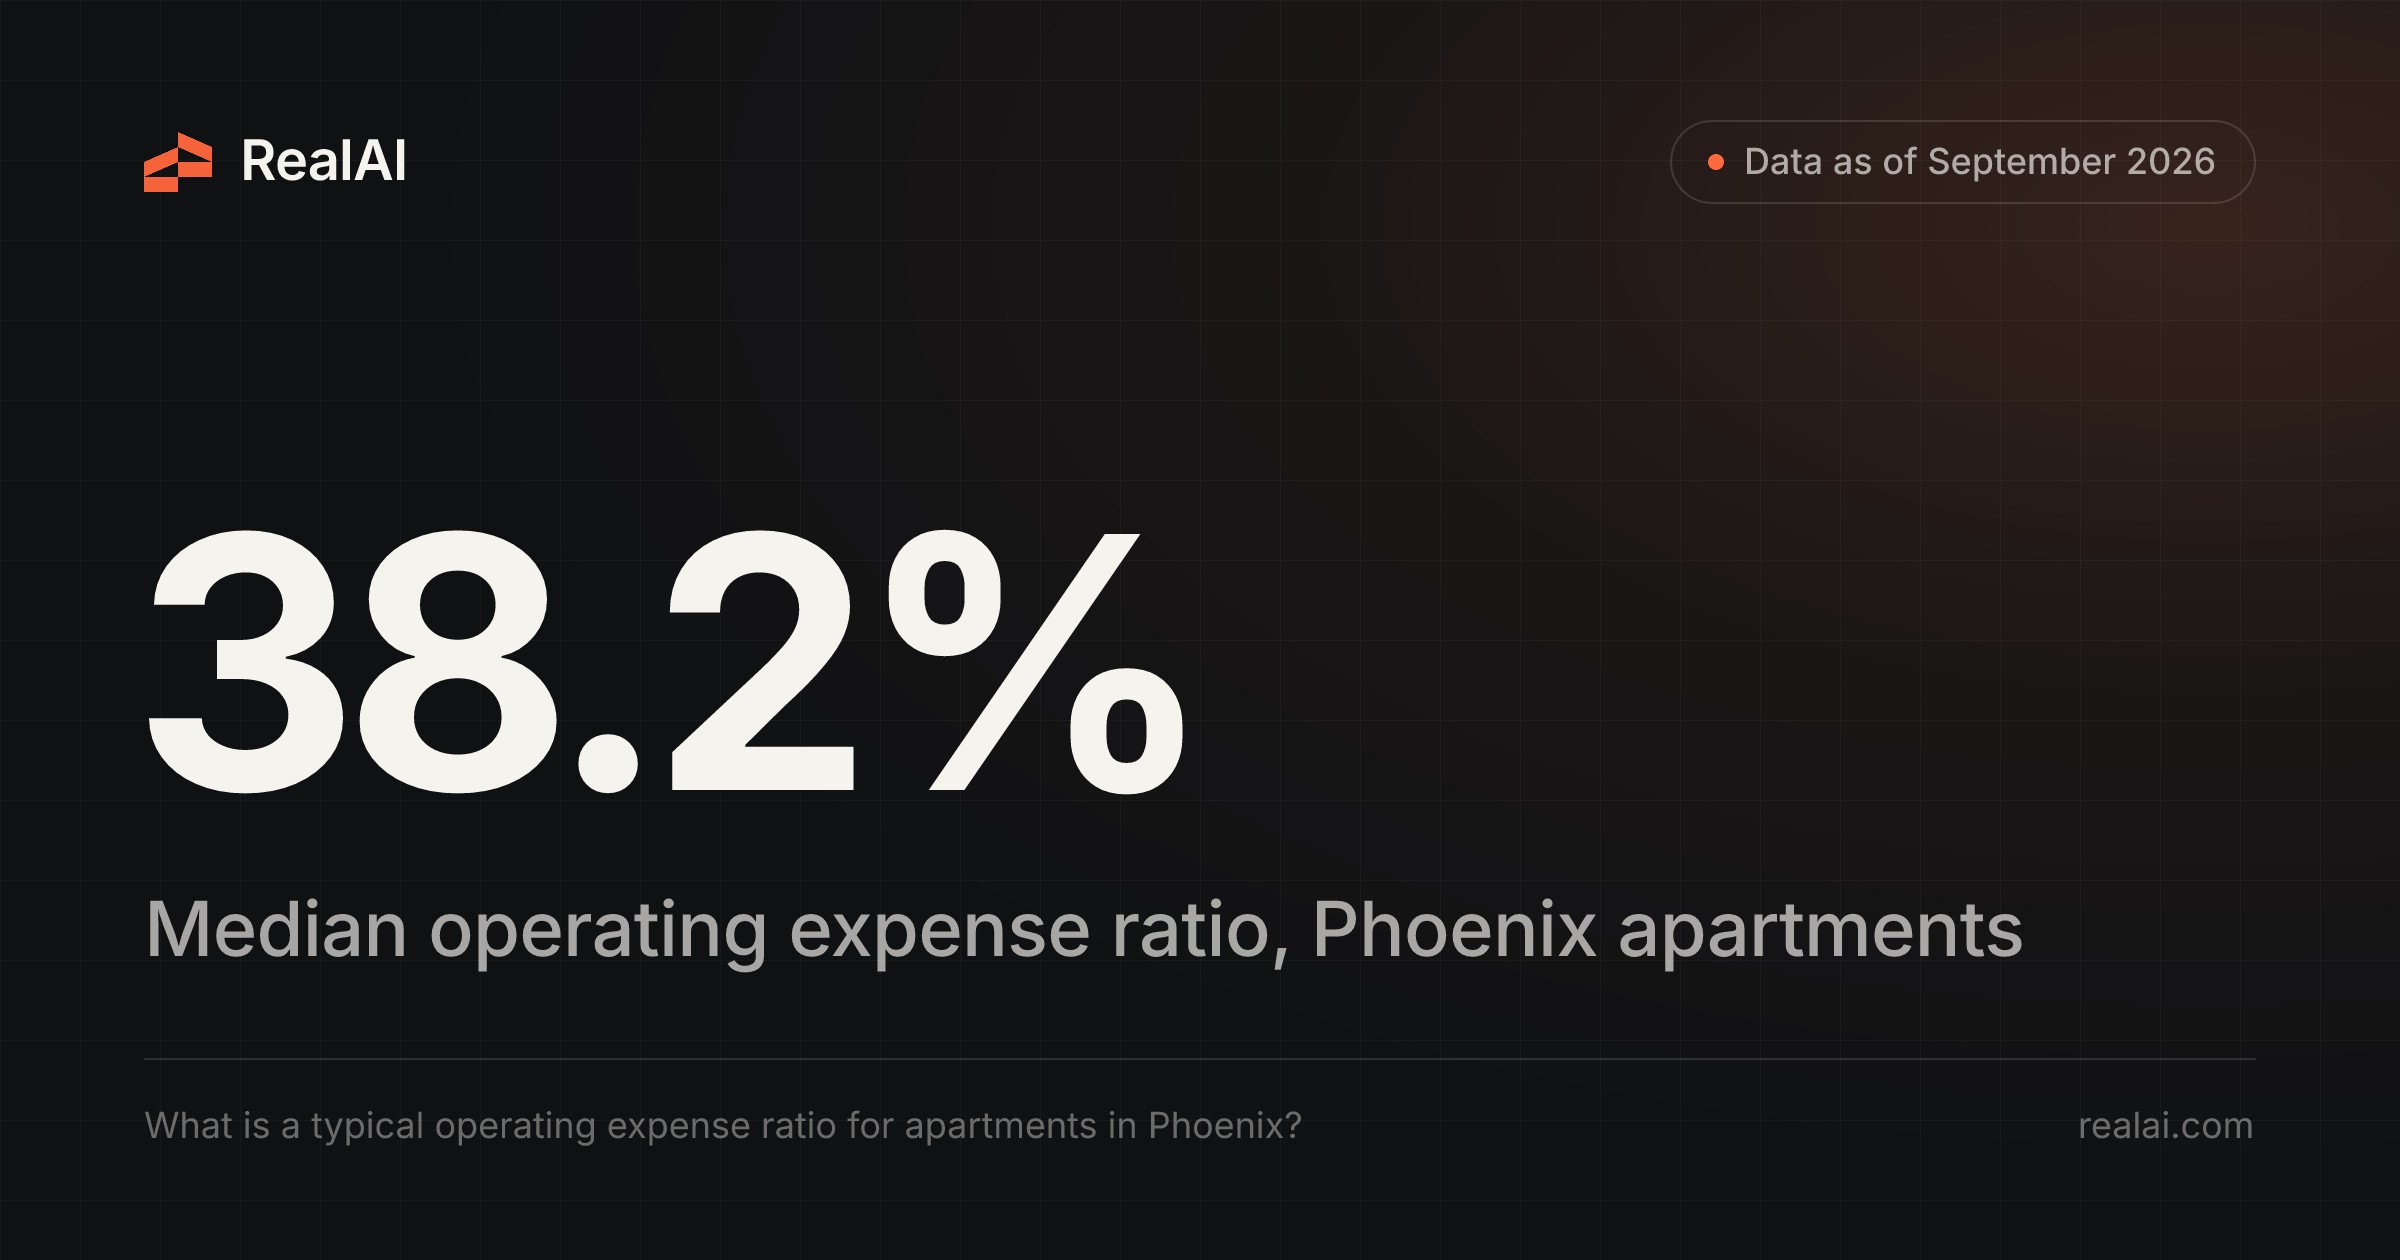

The median apartment property in metro Phoenix spends 38.2% of effective gross income (EGI) on operating expenses, as of September 2026, according to RealAI, the real estate AI built by Fundrise. The middle half of the 720 properties we measured falls between 34.0% and 43.8%. That leaves a median NOI margin of about 62%.
| Phoenix multifamily metric (% of EGI) | 25th percentile | Median | 75th percentile |
|---|---|---|---|
| Total operating expenses | 34.0% | 38.2% | 43.8% |
| NOI margin | 56.2% | 61.8% | 66.0% |
| Payroll and benefits | 8.1% | 10.3% | 12.8% |
| Utilities (owner-paid) | 5.4% | 6.9% | 9.2% |
| Repairs and maintenance | 3.7% | 5.1% | 7.6% |
| Property taxes | 3.0% | 4.0% | 5.9% |
| Management fees | 3.0% | 3.0% | 4.0% |
| Insurance | 1.8% | 2.6% | 3.6% |
Phoenix-Mesa-Chandler metro, property-level figures as of September 2026. The total covers 720 properties; taxes cover 582 and utilities 372. Each line's median is calculated separately, so the line medians don't add up to the total.
Phoenix runs leaner than the rest of the Sun Belt
Phoenix has the lowest expense ratio of the 10 Sun Belt metros we compared. Las Vegas is close behind at 39.3%. Charlotte and Orlando come in around 44–45%. Atlanta and Tampa sit near 48%. The big Texas metros all run above 54%.
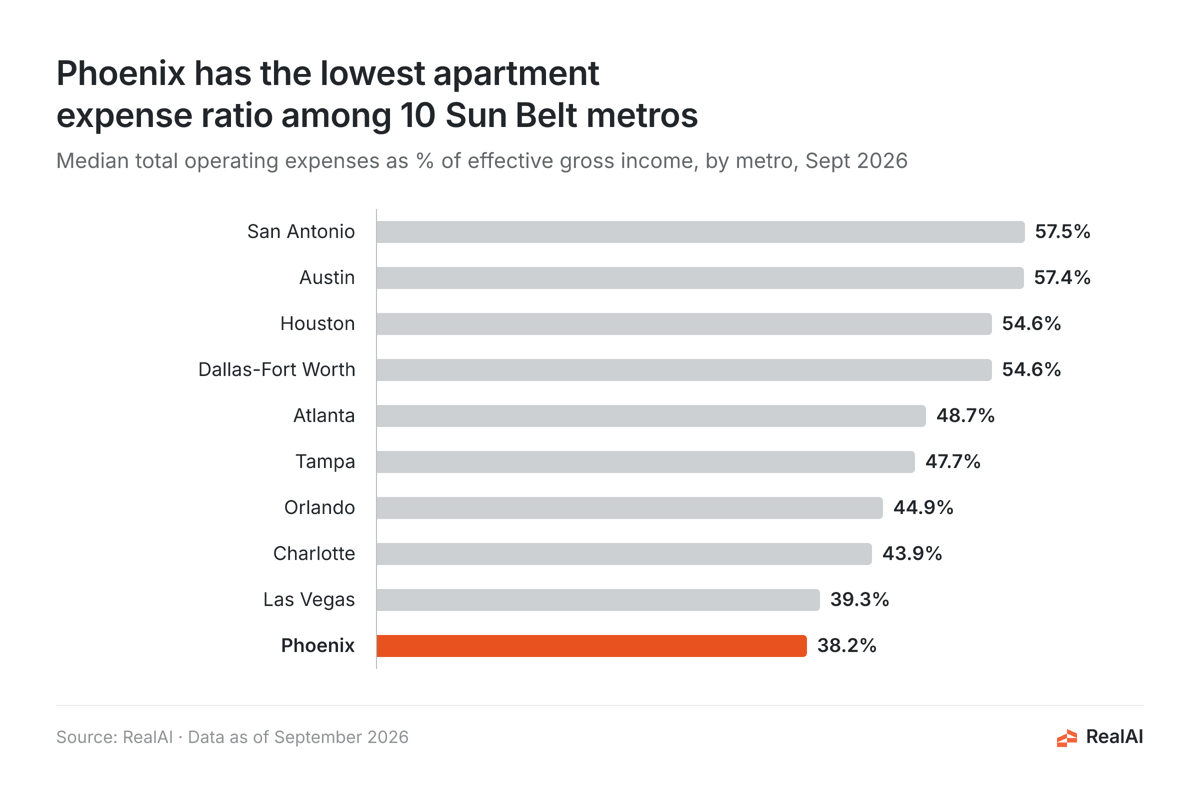
In practice, a Phoenix property keeps roughly 62 cents of NOI from each dollar of EGI. The median Austin or San Antonio property keeps about 43 cents.
Property taxes and insurance explain most of the gap
The lines that don't depend on where a property sits are fairly similar across metros. Payroll, repairs and management fees take about the same share everywhere. Taxes and insurance are where Phoenix pulls ahead.
| Metro | Median opex ratio | Median property tax (% of EGI) | Median insurance (% of EGI) | Properties |
|---|---|---|---|---|
| Phoenix | 38.2% | 4.0% | 2.6% | 720 |
| Las Vegas | 39.3% | 4.9% | 2.8% | 343 |
| Charlotte | 43.9% | 8.6% | 2.8% | 289 |
| Orlando | 44.9% | 12.4% | 4.9% | 222 |
| Tampa | 47.7% | 12.5% | 5.5% | 273 |
| Atlanta | 48.7% | 11.2% | 3.9% | 750 |
| Dallas-Fort Worth | 54.6% | 17.1% | 4.8% | 1,319 |
| Houston | 54.6% | 14.3% | 6.5% | 860 |
| Austin | 57.4% | 19.5% | 4.5% | 445 |
| San Antonio | 57.5% | 17.1% | 4.9% | 337 |
Property-level medians as of September 2026. "Properties" is the count with a total expense ratio.
The median Phoenix property pays about 4% of EGI in property taxes. In the Texas metros, that figure runs from 14% to almost 20%. That gap alone is worth 10 to 15 points of margin. Insurance adds to it. At 2.6% of EGI, Phoenix pays less than half the Houston share (6.5%) and well under the Florida metros, where wind and flood exposure push premiums up.
What fills the Phoenix budget instead
With taxes and insurance small, labor is the biggest single cost. Payroll and benefits take a median 10.3% of EGI. Owner-paid utilities come next at 6.9%, among properties that report them. Desert water, sewer and trash costs make that line worth watching when you underwrite a deal. Repairs and maintenance (5.1%), management fees (3.0%), G&A (2.9%) and marketing (1.5%) make up most of the rest.
A second view: the market benchmark
RealAI also publishes a market-level Phoenix benchmark built from a wider sample of 938 properties. It puts total operating expenses at 40.1% of EGI and NOI at 59.9%. The difference from the 38.2% property median comes from the sample and the method. Both figures are the lowest in our Sun Belt set. Use 38% to 40% as the central benchmark and 34% to 44% as the normal range.
How we calculated this
All figures come from RealAI's multifamily operating benchmarks, last updated September 30, 2026. The geography is the Phoenix-Mesa-Chandler, AZ metropolitan area (CBSA 38060). Each property's operating expense ratio is its annual operating expenses divided by its effective gross income (gross potential rent plus other income, minus vacancy and collection loss). Operating expenses include property taxes, insurance, utilities, payroll, repairs and maintenance, management, G&A, marketing and other expenses. Capital expenditures are not included. We report the median and the 25th–75th percentile across the 720 Phoenix properties that have a total expense ratio. Line-item counts vary because not every property reports every line. The figures are modeled from public sources, including HUD/FHA and agency securitization disclosures, SEC filings, tax assessor records and insurance data. They are benchmarks, not any owner's reported actuals.
FAQ
Is a 45% expense ratio high for a Phoenix apartment?
It's above normal. A 45% ratio sits past the 75th percentile (43.8%), so it is higher than at least three in four Phoenix properties. Check payroll, utilities and repairs first, since those are the largest controllable lines here.
What NOI margin should I expect in Phoenix?
The median is about 62% of EGI. The middle half of properties falls between 56% and 66%.
Does the expense ratio include capital expenditures?
No. Capex is tracked separately. In Phoenix, the median property spends about 1.5% of EGI on capex, on top of operating expenses.
Why are Texas expense ratios so much higher?
Mostly property taxes. The median property in Dallas-Fort Worth, Houston, Austin and San Antonio pays 14% to 20% of EGI in property taxes, compared with about 4% in Phoenix. Insurance is higher too, especially in Houston.
How much does insurance cost Phoenix apartment owners?
A median of 2.6% of EGI, with a typical range of 1.8% to 3.6%. That's among the lowest of the Sun Belt metros we track.
Want to benchmark a specific Phoenix property or submarket against these figures? Run your own analysis in RealAI.